Adaptive Congestion Prediction Approaches
ABSTRACT
Traffic congestion is a major factor to consider in the development of a sustainable urban road network. Several mechanisms have been developed to predict congestion but few have considered real-time congestion prediction. This paper proposes two adaptive congestion prediction approaches that adaptively choose between five different prediction algorithms using the Root Mean Square Error model selection criterion. Congestion is estimated by using a GPS based transmitter connected to an Arduino board with a GSM/GPRS shield that relayed the vehicle’s position to a cloud server. A control station then accesses the vehicle’s position in real-time, computes its speed and from that estimates the congestion level and it then applies prediction algorithms to the congestion level to predict the congestion for future time intervals. The performance of the prediction algorithms was analysed and it was observed that the proposed adaptive schemes provide the best prediction results with a lower Mean Square Error than all other prediction algorithms when compared with the actual traffic congestion states.
INTRODUCTION
Road traffic congestion remains a major problem in today’s era affecting both society and economic development. In United States, for example, over the last years every city has experienced an augmentation in traffic congestion (“TomTom Traffic Index”, 2017). This increase in congestion is related with various problems like pollution, noise and consumption of time and energy in travel. Traditionally, several methods like improving road infrastructure and urban planning were employed to reduce congestion, however, they were both costly and time consuming. Therefore in order to mitigate the problem, traffic congestion is predicted so that congested road can be avoided resulting in an improved performance and effectiveness of the public transport system. Previous studies have deployed model-based approaches as well as machine learning technique in the field of traffic congestion prediction. An overview of these previous researches is given next.
Prakash (2015) proposed a system with K-Means clustering and Naïve Bayes algorithms to detect and predict traffic congestion based on GPS data received from various GPS-enabled devices. Historical data as well as the travelling speed were used as input to the prediction model and an accuracy of up to 89% was obtained from the system. Yang et al., (2015) had proposed a novel approach using Traffic Flow Prediction (TFP) and Congestion State Fuzzy Division (CSFD) modules to predict traffic congestion using floating car trajectory data collected by taxi in Beijing. The Particle Swarm Optimization (PSO) algorithm in the TFP module optimized the parameter of the Support Vector Machine (SVM) in predicting traffic volume. The study showed that the PSO algorithm outperformed all other optimization algorithms in terms of prediction accuracy. Lwin and Naing (2015) made use of a Hidden Markov model(HDM) for forecasting traffic congestion using historical and real-time data and displayed the result of prediction on a Google Map. The system model was tested on different road segments during peak hours and the Hidden Markov model showed promising prediction result with an average accuracy of 86%. Prathilothamai et al. (2016) adopted Apache Hadoop and Apache Spark framework for increasing the accuracy of prediction with an advanced data processing technique. The data was collected offline using an Ultrasonic and Passive Infrared sensor during peak time and off-peak time. From the overall performance, the proposed prediction model achieved a precise prediction of congestion levels during high traffic.A complex hybrid prediction model was proposed by Lopez-Garcia et al. (2016) whereby a combination of Genetic Algorithm and Cross Entropy method (GACE) were used for forecasting short-term traffic congestion. The experiment was performed using Matlab and the data collected was used to test the performance of the model. GACE achieved a good performance with the lowest prediction error. Moreover, Liu et al. (2014) proposed a Bayesian Network approach to predict urban traffic congestion including a directional dependence analysis algorithm to learn the Bayesian Network structure. Their research incorporated historical data to test the system and the resulting performance showed that the proposed system was capable of representing and predicting the traffic congestion.
Although the above studies have implemented prediction models, very few have focused on the use of an adaptive approach to improve the accuracy of the prediction. This paper proposes the use of an adaptive prediction model which could select between the most appropriate predictor for a given set of observations based on the RMSE model selection criterion. The system consists of a GPS/GSM tracking devices installed in a bus that relays the time and position of the bus to a cloud server in real-time. A control station will then access the cloud server and computes the congestion based on the vehicle speed which is calculated from the GPS data. Predictive analytics is then performed by the control station to select the best predictor among the five algorithms; ARIMA, KNN, Linear regression, polynomial regression and Moving Average, to provide an estimate of congestion states for the next 0.3 kilometer distance.
The data was collected on two bus routes in Mauritius for a period of ten week days during peak hours. It was observed that the adaptive algorithm significantly outperformed all the other traditional prediction algorithms by providing a MSE of only 0.004 with respect to the actual congestion state. Moreover, the proposed framework and algorithm could even be used as a basis to predict congestion throughout Mauritius.
The organization of the paper is as follows. Section II describes the complete hardware and software architecture of the proposed bus prediction system. Section III deals with the system testing and performance analysis. Section IV concludes the paper.
PROPOSED CONGESTION PREDICTION SYSTEM
Figure 1 shows the overview of the proposed system.
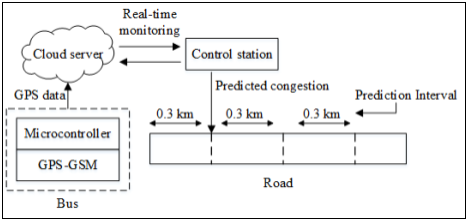
Figure 1. Proposed system model
The vehicle (bus) to be monitored is equipped with a tracking device which is an Arduino board mounted with a GPS and GSM module. The GPS information such as coordinates and GPS time are transmitted in real-time to the cloud server via the GSM module. The control station makes use of the Google API service to compute the distance travelled by the vehicle, from which the speeds of the vehicle and observed traffic congestions are calculated. The control station then applies predictive analytics to obtain the congestion state for the next 0.3 kilometer to be covered by the vehicle. The prediction process is repeated using the GPS updates received from the tracking device. The next subsection describes the hardware and software configuration for the vehicle tracking device, cloud server and control station.
Hardware Configuration
The core elements incorporated to implement the vehicle tracking device are; Arduino microcontroller, GPS module and GSM shield. Figure 2 shows the proposed circuit design and the interconnections among the hardware components.
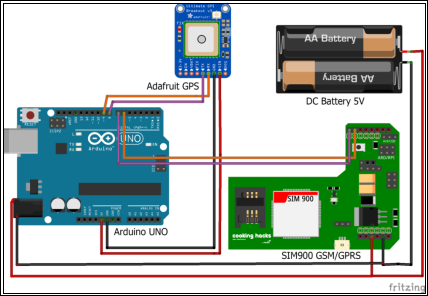
Figure 2. Proposed circuit design
The Arduino (AG, 2017) is the brain of the system that holds the program inside its flash memory to control the modules mounted on the board. The GPS module (Industries, n.d.) is used to acquire the vehicle location as well as GPS time from the navigation satellites. The GPS data is inserted in the query string of the cloud server URL address and the GSM shield (Arduino GPRS, n.d.) enables the tracking device to transmit the GPS data to the cloud server over the cellular network via the HTTP protocol. The GPS data is continuously transmitted to the cloud server with an interval of 10 seconds to avoid overlapping of GPRS data packets. The microcontroller and the modules mounted are power by an external battery of minimum five volts.
Cloud server setup
MySQL(MySQL, 2017) and PHP(Group, 2017) are the main components of the cloud server which interface the microcontroller and the control station. The server stores GPS data from the tracking device and provides access to the control station to the storage server. It runs on a web server which integrates various environments
MySQL is a database storage server that stores the GPS data in an organized form such as tablea. The PHP language executes PHP scripts files upon the request of a web user. The tasks performed by the PHP in the proposed cloud system includes establishing connection with the MySQL server, inserting records in the database table, retrieving GPS data from query string of the URL and interacting with Google API(Developers, n.d.) service using an API authentication key to calculate distance travelled.
Control Station configuration and predictive analytics
The main application for the control station is developed in Java platform using the open source software Netbeans IDE. The primary functions of the control station are to communicate with the cloud server, to monitor the vehicle in real-time and perform predictive analytics on the recorded traffic congestion states. The functions are described as follows.
With the help of a MySQL java file (MySQL Connectors, 2017), the control station constantly monitors the GPS data in the database server (MySQL) and computes the traffic congestion using the following equation.
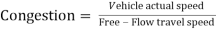 Â Â Â (1)
   (1)
Where, the speed of the vehicle is computed using Equation 2 and the free-flow travel speed refers to the ideal speed under zero congestion level. In this work, the free-flow travel speed is assumed to be 80kmh-1.
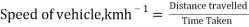 Â Â Â (2)
   (2)
Where Distance travelled refers to the distance covered with reference to the last GPS record in the database.
The control station then applies prediction algorithms to forecast the traffic congestion for the next 0.3 kilometers. The range of 0.3 kilometers is chosen in this study since the average speed of a bus does not exceed 80km/h and therefore this distance is long enough to improve the accuracy of the algorithms. The prediction algorithms developed in the control station are described below.
- Moving Average – It is a time series prediction which is based on the average of previous observations. A window of the observations of a predefined size is selected for the prediction.
- Autoregressive Integrated Moving Average (ARIMA) – It is a time series analysis that finds the best fit of a time series model to forecast future points in the series. ARIMA models are denoted by ARIMA (p, d, q) where p, d, q are numbers representing the order of autoregressive, degree of differencing and order of moving average.
- Linear Regression – A regression technique that formulates a straight line relationship between the dependent variable and independent variable (Zou, Tuncali, & Silverman, 2003). In this study, the dependent variable is the congestion state while the independent variable is the distance.
- Polynomial Regression – A regression technique in which the dependent variable is regressed on the degree (powers) of an independent variable (Ostertagová, 2012). In this study, the degree of the polynomial regression developed is 3.
- K-Nearest Neighbors – a simple machine learning model where the prediction is the average of k-nearest observations based on Euclidean distance metric. The neighborhood size, k is equal to the square root of the number of observations in the data set (Duda, Stork, & Hart, 2000).
The above prediction algorithms are applied to the observed congestion states as described in the steps below:
- The vehicle information (speed, distance, congestion state) is stored in an array data structure.
- The congestion state for the next 0.3 kilometers is predicted.
- The array is updated with new vehicle data from the cloud server
- The prediction process is repeated (Step 2-3) until no new updates are received from the cloud server.
Proposed prediction scheme
Prior to the prediction process, a cross validation(Picard & Cook, 1984) is first performed on the recorded dataset to generate a training and test data set with a ratio of 80% to 20% respectively as shown in Figure 3. Each prediction algorithms uses the training set (t1,t2,…t6) to estimate a forecast for t7. The squared error deviation between the actual and forecast value is calculated using formula given in Equation 3. The window of the training set is then shifted to t2 – t6 and the above prediction is repeated for t8.The error deviation is again computed between actual and forecast value of t8.
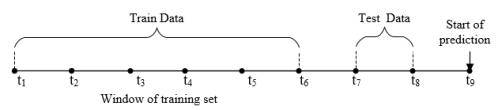
Figure 3. Cross validation process for sample size of 8 records.
  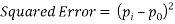              (3)
Where pi is the predicted value and p0 is the actual value. Once the error terms are computed, the RMSE is then used to select the predictor for t9 using the following equation.
 (4)
(4)
Where v is the number of data points in the test data. The prediction algorithm with the lowest RMSE is chosen as predictor.
The adaptive prediction schemes developed in the control station are described below:
- Adaptive prediction – uses the prediction algorithm with the lowest RMSE to predict the congestion.
- Hybrid Neural Network – combines the prediction algorithm with the lowest RMSE with a Neural Network model to predict the congestion. The proposed Neural Network architecture used in this work has the following model:
There are two neurons in the input layer (distance and congestion), seven neurons in the hidden layer which are found with a trial and error approach and one neuron in the output layer that provides the predicted congestion value. The activation function implemented is a sigmoid function which is used to determine relationship between inputs and outputs of the network. The learning process is performed by a back-propagation algorithm which adjusts the weights on the neuron in the hidden layer (Amita, Sukhvir Singh, & Pradeep Kumar, 2015). The proposed Hybrid NN is trained by passing the distance and measured traffic congestion at the input. The advantage of the Hybrid scheme is that the result of the predictor (lowest RMSE) is correlated with the actual data measured and hence fine-tunes the prediction result which is then produced at the output layer of the NN model. The next section assesses the performance of the prediction algorithms developed.
SYSTEM TESTING AND PERFORMANCE ANALYSIS
The performance of the predictive algorithms and the adaptive schemes were assessed on two routes in Mauritius as shown in Figure 4. The parameters for the prediction algorithms used during the testing phase are given in Table 1.
Table 1
Parameter set for the prediction algorithms during testing phase
|
Parameter |
Value |
|
Window size of Moving Average |
30 |
|
KNN Neighborhood size |
6 |
|
Neural Network Epoch |
1000 |
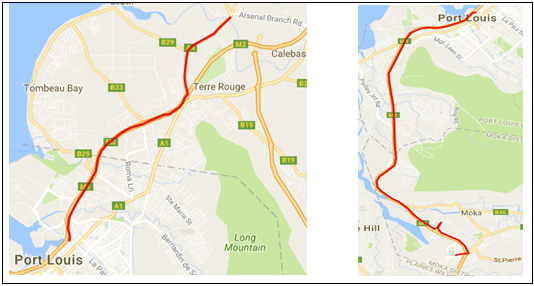
(a)Route1Â Â Â Â Â (b) Route 2
Figure 4. Google Map direction for Route 1 and Route 2
Table 2
Details of the routes selected for testing phase
|
Route 1 |
Route 2 |
|
|
Source |
Arsenal |
Port Louis |
|
Destination |
Port Louis |
Reduit |
|
Distance |
6.8 km |
12 km |
|
Data Collection Interval |
||
|
Morning |
7h00 – 7h30 |
7h30 – 8h15 |
|
Afternoon |
16h00 – 16h30 |
15h00 – 15h30 |
The performance of the algorithms was assessed in terms of the predicted and actual congestion states for a range of distances. Mean Squared Error (MSE) was used as metric to compare the performance of the algorithms. The tests were performed on ten week days. The results presented represent the average of the ten weeks recorded data sets.
Figure 5 and 6 show the graph of the predicted congestion state against the distance travelled for the seven algorithms as well as the actual congestion states. Figure 5 and 6 represent the morning and afternoon results for route 1. It is observed that the best performance is obtained with the adaptive algorithm