Analysis of Web Service Efficiency
Abstract
Web service standards used nowadays are Extensible Markup Language based and the important technology in communication between heterogeneous applications are over Internet. Thereby selecting an efficient web services among numerous options satisfying client requirements has become a challenging and time consuming road block. The path for the optimal execution of all the user request is done using the Hidden Markov Model (HMM). The results have shown how our proposed methodology can help the user to select the most reliable web service available. Our analysis is about creating a cost effective servicing mechanism for web services, if effectively implemented this concept will reduce the need for network engineers in maintenance of web services. As a result of the parallelism technique used in this analysis significant reduction in RT and increase in composition speed has been observed.
Keywords: Hidden Markov Model (HMM), Extensible Markup Language, Web Services, Service Quality Architecture (SQA)
1. Introduction
In the Service Web the feedback of customers constitutes a substantial component of Web Service trustworthiness and reputation, this in turn affects the consumer service uptake in the future. All that we presents here is an approach to predict and assess the various reputations that are prevalent in the services oriented environment that is prevalent. All the web services enable computer-computer (c2c) communication in a heterogeneous environment, hence they are very suitable for an environment such as the internet. People can use the standardized web service model for rapid design, implement and extended applications. Many enterprises and corporations provide different web services to be more responsive and cost-effective.
All activities that are composite services in nature may be defined by the graphs of control flow and the after coming data graphs. As a service provider, the foremost importance is for the bound(upper), the mean RT of a request given some request load and some architectural environment. Furthermore, this computation should be only performed before the actual deployment and usage of the service. In exceptional cases of service that’s of composite nature this performance of the service depends on only the hypotheses about all the invoked service that are elementary in nature. Component approaches another very important benefit is reuse. In the web service definition language all the service that are of elementary nature are conceptually limited to relatively very simple features that can be only modeled by a collection of operations that co exist. Moreover, in due to the application kind its very much necessary to combine a set of all the web services into a single composite web service. All of the proposed methodology exploits is the ideas from the Software Architecture- and Component-based approaches to software design.
The process of web service selection and discovery of system is essential to provide the clients with proper results and that fulfills their requirements. Its impossible for anybody to fulfill the task without considering all the ranking relations that exist between thousands of various available candidates that have similar functionalities. Thus, ranking is a fundamental process of a Web service selection system, as this integrates all the results that’s gathered from previous stages and presents them to those requested. This paper is focused on the various ranking process by considering user’s SQA requirements.
- Hidden Markov Model (HMM)
A Hidden Markov Model is very well related to the study of how likely or unlikely things are going to happen in the graphical model that is available and well suited in dealing with a sequence of data that are related. The very basic way of thinking this is that we have a set of states, but the road block is we wouldn’t know the state directly (this is the reason that makes it hidden). Instead of this, we can only make a state, but we are not in position to tell the state of proceedings for sure. Addition to this is that there are changes (from one thing to another) that is in between states. Each of the change (from one thing to another) between the states is also called as a chance. Sometimes these are known, sometimes they are not known. These states are very flexible instrument that can be put to use not just for clarification purpose but also for (division of something to smaller parts) the purpose and even to create or “see or hear things that aren’t there” data. The property of “generative” works by training a model on this data and then randomly creating chances of (instance of watching, noticing or making a statement) and change (from one thing to another). In this way, you can “create” data using a hidden markov model.
2.1 Definition
Our model of HMM is defined by specifying the following variables:
X = {x1, x2, …, xn} = set of states
Z ={z1, z2, …, zm} = the output alphabet
Ï€(i) = probability of being in state xi at time t = 0
A = transitional probability = {aij}, where aij= P r[entering state xj at time t + 1 | in state xiat time t].
Note that the probabilities of going from state i to state j doesn’t depend on the previous states at earlier times.
B = output probability ={bj(k)},
where bj(k) = P r[zk at time t | in state xj at time t].
For the purpose of giving an example, let’s say that we have two biased coins, which we are ipping, and an observer is seeing the results of our coin ips (not which coin we’re ipping). In fact, suppose that what we are actually doing can be described by Figure1.Here, the states of the HMM are q1 and q2 (the coins), the output alphabet is fH; Tg, and the transition and output probabilities are as labeled. If we let(q1)=1and(q2) = 0 then the following is a example of a possible transition sequence and output sequence for the HMM in the following diagram.
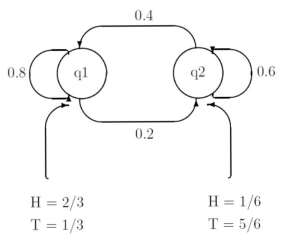
We can easily calculate probabilities for the following events.
1. The probability of the above transition sequence:
Pr[x1x1x1x2x2x1x1]= π(x1)a11a11a12a22a21a11≈ 0.025
- The probability of the above output sequence given the above transition sequence: Pr[HHTTTTH]|(x1x1x1x2x2x1x1)] = 2/3,2/3,1/3,5/ 6,1/3 ,2/3 ≈0.023
- The probability of the above output sequenceandtheabovetransition sequence: Pr[(HHTTTTH)^(x1x1x1x2x2x1x1)] ≈ (0.025).(0.023) ≈ 5.7 Ã- 10-4
2.2 HMM Applications
- Classification: speech recognition (time series), handwriting recognition (sequence of points), patterns and motifs in DNA (sequence of characters), analyzing video sequences.
- Modeling transitions: road snapping to work out which segment the user was most likely on (a sequence of points).
- Generation: text to speech (another time series application).
Calculating the transition probability depends on the problem you are trying to address. In some cases (e.g. road snapping) you can compute it directly from the data.
If you know the observation probabilities, then working out the transition probabilities is relatively easy (it comes down to finding the path that maximizes the observation probabilities and doing a “count” to get a measure of the transition probabilities). The most popular of all probability estimation approaches for HMM is the Baum-Welch algorithm, which allows the estimation of both observation and transition probabilities simultaneously.
3. Service Quality Architecture (SQA)
The most important Service Quality Architecture that is used in this paper are RT, cost of execution, availability of space, all the reputation and the successful rate of execution. The RT can be defined in quite a few ways. For instance, RT can be stated as the time in between the sending of request and that of receiving the response. This is the period that involves all the receiving request of message time, QT(queuing time), ET(execution time) and receiving RT by the requester. Measuring these time sections is very difficult because they depend on network conditions. Alternatively, it can be measured as the time between receiving request by service provider and sending response to service requestor.
This time it includes QT and ET only affected by the workload of the web service. This is the value that must be continuously updated in each and every web services because of the work load that’s of changing nature and web service may change during the work time. Execution cost of this process is a fee received by the service provider from the service requestor during each and every execution. The fee for this is determined solely by the service provider and can change due to the web service provider’s financial policy at that moment. The availability is a very important degree, that is a web service is accessible and ready for immediate use at any given point. From service requester for each execution. This fee is determined by service provider and may change according to web service provider’s financial policy. Availability is the degree that a web service is accessible and ready for immediate use.
3.1 SQA Notations
The Service Quality Architecture used in this paper is summarized in Table1:
|
SQA |
Description |
|
RT |
It is the time between receiving and sending request |
|
EC |
Execution cost request |
|
Availability |
Up time Up time down time |
|
Reputation |
Repi Total no.of usage |
|
Successful ER |
No.of successful request Total no.of request |
Descriptions of notations used in this paper are as follow:
m: number of tasks.
n: number of candidate web services for each task.
pi: i-th atomic process of a composition schema (1
≤ i≤ m).
wsij: j-th candidate web service for the ith atomic process, (1 ≤ i≤ m , 1 ≤ j ≤ n).
d: index of SQA .
wd: weight of the d-th SQA constraint defined by a client.
Cond:permissiblevalueofthe
d-th SQA (constraints).
Aggd: aggregated value of the d-th S Q A of a composition plan.
bij: binary decision variable (0 or 1). If bij=1 then j-th candidate web service is selected for i-th process.
3.1 Aggregation Value of SQA
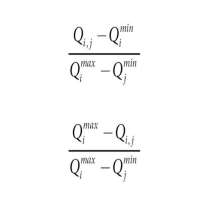
Generally, composition plans are constituted from serial, cycle, XOR-parallel and AND-parallel execution patterns. According to the definition of SQA, the aggregative value of web service composition is calculated regarding to its workflow pattern. The description and aggregation values of workflow patterns are discussed below. For the negative criteria, all the values are scaled to equation 2. For positive criteria, all the values are scaled to equation 1.
In our paper the values of n SQA attributes of a service S as a vector: Qs = (Qs1, Qs2, …,Qsn) are modeled and all the value of SQA requirement requested by a consumer are vector Qr = (Qr1, Qr2,…Qrn) are considered. All the consumer’s preference values thus are set on SQA attribute that are each in a vector pr = (pr1,pr2,…,prn)where pri[1,n].Thus if a consumer has no preferences over an attribute, n will be considered the default preference value for that specific parameter.
- Related Works
The times of server for the database of composite nature Web services have been examined in full detail, this follows the fork-join execution model. The proposal of the author here is that while performing a join operation or execution, the servers with slow RTs will be eliminated to maximize the performance of the server. All the work here is the more orientation towards examination of the fork-join model thereby to understand the resulting merger of data from various servers. All the work in this domain regarding the performance of the Web services is more inclined towards the composite web services and their RT. When the execution of a composite service that have been examined as a fork-join model. Thus here in the model of the states that a single application in the Internet that invokes many different Web services that are in parallel and thereby gathers their responses and from all the launched services to return thereby, all the results to a client are not affected in general.
The perfect explanation of the fork and the join system, that is under some hypothesis is to be found. This hypothesis states that the number of servers that is equal to 2, when the job arrival is in the Poisson process and that the task are in exponential service time distribution in general. The great scientist Nelson and Tantawi proposed that an approximation in the case where all the number of servers is much greater or equal to that of 2 and a homogeneous and exponential servers. After which, a more general case that is presented is where the arrival and service process are general in nature.
Particle Swarm Optimization (PSQ, Interactive Evolutionary Computation(IEC),) and Differential evolution (DE) are the major 3 evolutionary algorithm that are on focus in this paper. When IEC is the suitable algorithm for discrete optimization (DO), PSO and DE that offer the continuous optimization are more natural. In this paper we give an introduction to all the 3 similar type of EA techniques to highlight all the common procedures of computation. The most common one we have is the observations in the similarities and differences among the 3 algorithms that are based on various computational steps that are discussed here contrasting to their basic performances. Overall the summary of the literatures discussed is given on the location allocation, flexibility in job shop, multimode resource project that have scheduling road blocks and vehicle routing constraints.
4.1 Average RT Calculation
The average RT calculation is a measure of the time that an Enterprise Server consumes in order to return the result that is correct and needed. The RT gets affected by numerous factors such as the quantity of user, bandwidth of network that’s available at that point of time, average think time of the server and the basic request type submitted to the server.
Here in this section, the RT refers to the average or mean RT. Each and every type of the request has own minimal RT. Even though, when during the evaluation or the testing of the system performance, RT is based on the analysis of average RT of all the requests that is sent to the server. More faster the RT of web service, the more requests/min are being processed overall. However, as the number of users on the system rises, the RT starts to rise proportionally, all though the number of request/min decreases.
The below mentioned graph of the system performance of all the server indicates that after a point, the requests/min are inversely proportional to RT. The more sharper the downfall in the requests/min, the steeper the increase in RT.
The below mentioned figure clearly point at peak load which is when there quests/min starts to fall. Before this point, RT calculations are not precisely done and was not necessary because they do not use the peak numbers in the formula. But from now on, this point in the graph, the admin is more precisely calculated RT by using maximum number of users and requests/min.
The formula used above is calculated using the below method and notations.
Tresponse, that’s the RT(in seconds) at peak load:
Tresponse = n/r – Tthink
- No.of con-current users is denoted by n
- No. of requests/sec that the server receives is denoted by r
- The avg think time (in sec) is denoted by Tthink
The think time is always included in the equation to get a precise and accurate RT result.
If
- n is max, then the system supports at peak load is6,500/second.
- r is at peak load, then the system can process at peak load is 2,770/second.
The avg think time, Tthink, is 5 sec/request.
Therefore RT is calculated by the following formula:
Tresponse = n/r – Tthink = (5000/ 1000) – 3 sec. = 5 – 3 sec.
Thus, the RT is 2 seconds.
Application Server performance’s critical factors are RT, along with throughput. Everything after the system’s RT is being calculated at the peak load.
5. Proposed Methodology
Optimal web service composition plan that is a composition plans of this road block is very large (nm), is proposed in our paper that presents an approach to find and improve GA that are presented, it quickly converges all the appropriate composition plan. The Tabu search that is being used for generating the neighbor plans and are simulated annealing the heuristic that is applied for accepting or rejecting the neighbor plan. In this phase, all the services that’s located after the user’s requirement will be deleted. Thereby, the remaining services that fulfill the user request. Now among these services, a service with the higher score will be selected.
We have proposed the Tabu search and the simulated annealing (SA) that is a constrained satisfaction based approach. Yet, the approach has a high possibility of not completing the local optimum because it is unable to work on more than 1 composition plan simultaneously. We presented an approach in which genetic algorithm is used to find the optimal composition plan. The SA method applies progressive updates to the further generation and the selection of chromosomes to increment the speed of the algorithm performance. Thus, Self-orchestration explains all the Interaction between and within the services that itself orchestrates, before doing anything it actually does the execution. One of the primary languages for the defining self choreographies is the Web Service Choreography Description Language.
When this is used partial initialization of chromosomes to escape all the local optimums in general. After all, this proposed method will works on a test sample of composition plans, which is on the contrary to the Tabu method. The different composition approaches that describes the different composition models is provided, which are self-orchestration, self-choreography, self-coordination and part of the component. Self-Orchestration is a description of how the services that participate in the composition of interaction at the message level, including the various order in which iterations that possibly should be executed as well as the business logic.
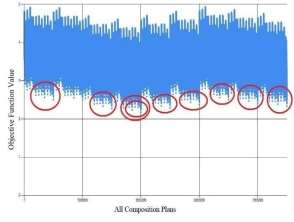
Fig 1: Values of All Web Services and Tasks
5.1 Proposed Design
The following diagram shows the activity functions. By using the database it will show all the relevant content to the user. And it tells about the flow of activity of each object. Activity diagram is another important diagram to describe dynamic aspects of the system. It’s basically a flow chart that represent the flow from one activity to next activity. In this case the following diagram consist of Server, User, database, checking various query and Sub query. Each actor will perform certain function to achieve the desired goal. First a user enters into a system by providing correct user name and password. After this we will be able to type the query.
A use case diagram in its simplest form is a representation of a user’s interaction with the all the system and depicting the various specifications of a use case. This should be noted that the process of filtering all the web services consists of functional match making and non-functional matchmaking as well. In functional matchmaking, all the web services that have different functionalities from the client are filtered out fully and on the other hand, in non- functional matchmaking, the web services that don’t have the appropriate quality are only eliminated.
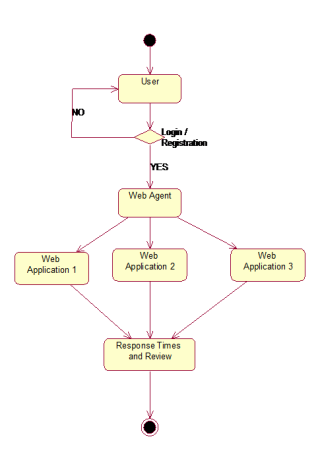
At this stage, the candidate web services for each task are selected. Now the details of the user are fetched into the web agent memory or a temporary storage allocation site. Further the web agents analysis the various web applications in order to finalize the optimal web servers and the resulting information are displayed with user comments and reviews.
Fig 2: Flowchart
The below diagram tells about the different sequence we are following to make a user to view his related content. In this diagram contain different object like User, database, Validate, relevant and web access. And it tells about the flow of sequence between the objects. A sequence diagram is a kind of interaction diagram that shows how processes operate with one another and in what order. It is a construct of a Message Sequence Chart. The user inputs the login details and connects through we access which are then linked to the time and review request. Now, web agent analysis the various requests from the web applications and provides the information regarding the time and review and gives the possible details to the user.
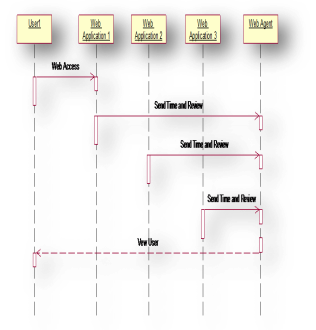
Fig 3: Sequence Diagram
In recent years, the application of web-based systems in institutions and government agencies is increasing. Introduction of web services is an effective approach in business structures to provide the required capabilities of service providers for services composition. Selecting the precise user service based on the user’s request is primarily based upon the service quality of the available web services. Several different methods have been suggested to solve the road block of web services composition based on qualitative characteristics. These methods can be divided into two types of exact methods and approximate methods. The first type is known as non-innovative methods which selects the best design from all available designs by examining and calculating the candidate’s routes and thus provide a more precise answer. In the second type or innovative methods, contrary to the first type, an ideal design that is close to the best and most accurate answer will be chosen.
The below mentioned graph that actually compares the various web services that are available in that field and displays its performance based on RT and user reviews that are given.
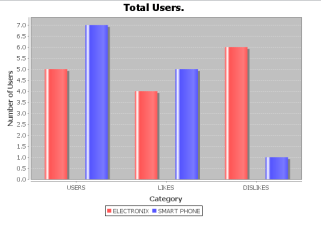
Fig 4: Resulting Graph
Due to the importance of optimal composition of web services in recent years, a lot of works have been done in the field of each method. By studying various types of innovative algorithm, one can conclude that many road blocks still exist to solve in web services composition based on qualitative characteristics. For instance, each of these methods usually have local optimality road block alone or in genetic algorithm that are non complex and basic, the crossover type and the operation of mutation acts randomly and without any guidance, which leads to degeneration of the method. Therefore, efforts to improve efficiency such as using combined methods, operators like revolution operator or adding functions to improve were performed.
These techniques are provided for better speed, faster convergence, and higher efficiency in large spaces. Based on the mentioned studies, there is no specific benchmark tool for evaluating the algorithm. Although some researchers used different simulation environments or different data to compare them with each other, the results show that different methods have different disadvantages and they do not have any specific standard. Skyline algorithm method and parallelism technique are used in this proposed method in order to provide the best composition with regard to the shortest RT in high scalability.
- Conclusion
For the purpose of retaining their client all the web services first priority is maintaining Service Quality. This paper pays attention to the RTs of composite Web service that plays a very important role in attaining service quality in web services.. We propose a heuristic model for predicting RT of web service and thereby selecting an optimal web service at the runtime from the list of functionally similar web services. For the purpose of the probabilistic instances of Web Services. We have used Hidden Markov Model. Our model has been made with the assumption of Web Services that is deployed on a cluster of web servers and thereby sometime the delayer crash during WS invocation happens which is because the bad node in sever clustering responds to request of the user. By using HMM where ever needed we have predicted the probabilistic nature and predicted the behavior of these web servers and then selected the Web Services based on their optimal probabilistic value.
An approach is proposed to solve the Service Quality Architecture aware Web Service selection road block. To avoid this problem, an SQA based algorithm is presented that will reveal all selection leading to the results that’s very close to optimal, efficient solution. This process in arriving at the solution is also done at a rapid speed which is worth mentioning.
7. Reference
- SalehieTahvildari L. Selfadaptive software: Landscape & research challenges. ACM Transactions on Autonomous and Adaptive Systems. 2009;4:1-42.
- T.Rajendran, P.Balasubramanie. An efficient architecture for agent-based dynamic web service discovery with SQA. Journal of Theoretical and Applied Information Technology; Islamabad Pakistan. 2010 May; 15(2).
- J.Cardoso, et al. Quality of service in workflows and Web service processes: Web Semantics Science, Services and Agents on the WorldWideWeb.2004; 1:281-308.
- CardelliniV, et al. MOSES: A framework for QOS driven runtime adaptation of service-oriented systems. IEEE Transactions on Software Engineering.2011.
- ErradiA, Maheshwari P. Dynamic binding framework for adaptive web services. Proceedings of the 2008 Third International Conference on Internet and Web Applications and Services; 2008.
- LIU, Z., J. LI, J, LI, A. AN, J. XU, A Model for Web Services Composition Based on SQA and Providers’ Benefit, Proc. Int. Conf. on Wireless communications, networking and mobile computing, Beijing, China, (2009), pp.4562-4565.
- SIRIN,E.,B.PARSIA,D.WU,J.HENDLER,D. NAU, HTN Planning for Web Service Composition Using SHOP2, Web Semantics Vol.1, (2004), pp. 377-396.
- D’AMBROGIO, A, A Model-driven WEB SERVICE DEFINITION LANGUAGE Extension for Describing the SQA of Web Services, Proc. IEEE Int. Conf. on Web Services, (2006), pp. 789 -796.
- LIANG, W.Y., C.C. HUANG, H.F. CHUANG, The Design With Object (DWO) Approach to Web Services Composition, Computer Standards & Interfaces, Vol29, (2007), pp.54-68.
- FERCHICHI, S.E., K. LAABIDI, S. ZIDI Genetic Algorithm and Tabu Search for Feature Selection, Studies in Informatics and Control.
11.F.CURBERA., M. DUFTLER, R.KHALAF,W. NAGY, N. MUKHI, S. WEERAWARANA, unraveling web services, An introduction to SOAP, WEB SERVICE DEFINITION LANGUAGE and UDDI, IEEE Internet Computing , Vol.6 (2002), pp.86-93.
12. KOSHMAN.S, visual -based information Retrieval on the Web, Library and Information Science Research Vol.28 (2006), pp.192-207.
13.CHEN L.S, F.H HSU, M.C CHEN, Y.C HSU, Developing Recommender Systems with the Consideration of Product Profitability for Sellers, Information Sciences, Vol.178 (2008), pp.1032-1048.
14. CHEN Y, L.ZHOU, D.ZHANG, ontology-supported Web Service composition, An approach to service-oriented knowledge Management in Corporate Services , Database Management Vol.17 (2002), pp.67-84.
15.O’SULLIVAN J, D.EDMOND, A.T HOFSTEDE, what’s in a service? Disturbed and Parallel Databases Vol.12 (2002), pp.117-
Order Now