Association of Lipid Profile in Pregnancy with Pre-eclampsia
Association of Lipid Profile in Pregnancy with Pre-eclampsia, Gestational Diabetes Mellitus and Preterm delivery
Babita Ghodke*,1, Raghuram Puskuru2, Varshil Mehta3, Kunal Bhuta4
1Associate Professor, 2Senior Resident, 3Intern, 4Junior Resident
Department of Medicine, MGM Medical College, Navi Mumbai, India.
Abstract
Introduction: During last two trimesters of pregnancy, glucose is spared (for the foetus) while the concentration of fatty acids in plasma increases which can create complications like Preeclampsia, Gestational diabetes mellitus and preterm delivery.
Aim: To study the association of serum lipid levels during second and third trimester with the development of pregnancy associated diseases like preeclampsia, GDM and preterm.
Methods and Materials: The present study was carried out at MGM Hospital, Navi Mumbai, India. 200 antenatal cases from October, 2012 to October 2014 were enrolled after taking an informed consent. Statistical analyses were performed using Statistical Package for Social Sciences (SPSS) version 20. All reported p-values are two-tailed, and confidence intervals were calculated at the 95% level.
Results: In pre-eclamptic patients, the mean Systolic Blood Pressure was 151.40 mm/Hg and mean diastolic blood pressure was 74.03 mm/Hg in third trimester. In pre-eclamptic patients, the mean serum triglyceride levels in second trimester was 204.00 mg/dl while 243.20 md/dl in third trimester. In Gestational Diabetes Mellitus patients, the mean serum triglyceride was 214.33 mg/dl in second trimester while 230.50 mg/dl in third trimester. In patients with preterm, the mean triglycerides levels 212.83 mg/dl and 240.16 mg/dl in second and third trimester respectively. In pre-eclamptic patients the mean serum cholesterol levels in second trimester was 210 mg/dl, while in third trimester, it was 243.60 mg/dl. In GDM patients, the mean serum cholesterol was 223.50 mg/dl and 242.83 mg/dl in second and third trimester respectively. 213.33 mg/dl and 243.66 mg/dl were the means cholesterol levels in second and third trimester respectively in patients with preterm. Out of total 200 patients 168 had no complications, while 20 {10%} had preeclampsia, 6 {3%} had Gestational Diabetes Mellitus and 6 {3%} had preterm deliveries.
Conclusion:An association between maternal early pregnancy triglyceridaemia, and the subsequent risk of pre-eclampsia, gestational diabetes and preterm deliveries was observed. Occurrence of Preeclampsia, Gestational Diabetes and Preterm deliveries cannot be predicted based on the values of Serum Cholesterol, HDL-Cholesterol, LDL-Cholesterol and VLDL-Cholesterol. Hence estimation of lipid profile is strongly recommended during pregnancy to prevent deleterious effect of hyperlipidaemia associated with pregnancy.
Keywords: Lipid Profile, Gestational Diabetes Mellitus, Preterm, Preeclampsia, Pregnancy related disease.
1. Introduction
Pregnancy is a physiological process which causes profound changes in the body. It leads to an increase in demands for metabolic fuels and also causes alteration in hormonal levels which may cause few changes in lipid profile during pregnancy [1].
During last two trimesters, glucose is spared (for the foetus) while the concentration of fatty acids in plasma increases which leads to Gestational Diabetes Mellitus (GDM) and Gestational Hypertension (GHTN) respectively. Freinkel had described this process as “accelerated starvation”, and “facilitated anabolism” [2].
GDM and GHTN can lead to peri and postpartum complications. Pregnancy is often also complicated with diseases which can hamper Cardio-Vascular System. GDM and GHTN are few of them which can develop type 2 diabetes and systemic hypertension in later part of life [3,4].
In our previous study, we showed that total cholesterol, triglycerides, LDL-cholesterol, VLDL-cholesterol increases in last two trimesters. The increase is even greater in third trimester, when compared to the second. However, HDL-Cholesterol levels are decreased in third trimester when compared to that of second. The study concluded that the estimation of lipid profile is highly recommended during pregnancy due to its association with high levels of triglycerides which may lead to Pre-eclampsia, GDM and preterm delivery [5].
The present study is a continuation of our previous study and here, it evaluates the clinical significance of the lipid profile level in pregnancy and its effect on the development of pregnancy induced diseases like GDM, pre-eclampsia and preterm.
2. Aim
To study the association of serum lipid levels during second and third trimester with the development of pregnancy associated diseases like preeclampsia, GDM and preterm.
3. Material, Methods, Ethics, Statistical Analysis, Inclusion and Exclusion Criteria
The present study is a continuation of our previous study and the material, methods, ethics, inclusion and exclusion criteria could be obtained from our previous study [5].
In brief, the present study was conducted at Mahatma Gandhi Mission Hospital, Navi Mumbai, India. A total of 200 pregnant local women were enrolled from October 2012 to 2014. Out of the 200 subjects, 10 developed GHTN in late third trimester which was detected after 32nd week during follow-up which were also included. The venous blood sample was collected from all subjects for measurement of lipid profile in the 16th week and 32nd week of gestation for analysis.
All pregnant women with a singleton pregnancy with a gestational age of 13-28 weeks, irrespective of parity and gravida were included. Pregnant women in whom hypertension (HTN) was detected before 14 weeks and those with diseases or complications like chronic HTN, Diabetes, Renal Disorders and Thyroid Disorders, Obstetric and Foetal Complications (Hydrops foetalis, congenital foetal anomalies) were excluded.
Statistical analyses were performed using Statistical Package for Social Sciences (SPSS) version 17.0. All reported P values are two-tailed, and confidence intervals were calculated at the 95% level. The data was presented using frequencies, percentages, descriptive statistics followed by charts and graphs. Level of significance was set at 5%. All p-values less than 0.05 were treated as significant.
4. Results
The mean age of patients was 24.87 years with a SD of 2.7 years. The minimum age was 18 years and the maximum age was 30 years.
4.1 Blood Pressure
The mean Systolic Blood Pressure (SBP) in second trimester was 117.03 mm/Hg with a SD of 10.33 mm/Hg. In third trimester, it was increased to 120.77 with a SD of 14.675.
In pre-eclamptic patients, the mean SBP was 151.40 with a SD 6.05. (p =0.00) in third trimester. There was a highly significant statistical difference in the mean blood pressure values among normal and pre-eclamptic women in third trimester.
The mean Diastolic Blood Pressure in our study in third trimester was 72.11 mm/Hg with a SD of 6.88 mm/Hg. In third trimester, the mean SBP was increased to 74.03 with a SD of 8.616. In pre-eclamptic patients the mean was 92.00 with a SD 2.59 (p =0.00). There was a highly significant statistical difference in the mean blood pressure values among normal and pre-eclamptic women in third trimester. Out of total 200 patients 168 had no complications, while 20 had preeclampsia, 6 had GDM and 6 had preterm deliveries.
4.2 Association of Triglycerides with Preeclampsia, GDM and Preterm
The below table (figure 1) indicates the 95% confidence interval for triglyceride levels for patients with outcomes of Preeclampsia, GDM and Preterm. The mean triglyceride level in second trimester was 188.68 mg/dl with a standard deviation of 20.88 mg/dl. In third trimester, the mean triglyceride (TG) level was increased to 216.78 mg/dl with a standard deviation of 20.09 mg/dl [5].
In pre-eclamptic patients, the mean serum triglyceride levels in second trimester was 204.00 with a SD 18.904 (p =0.00), while in third trimester, the mean was 243.20 with a SD of 15.58 (p =0.00). There was significant statistical significance observed between serum triglyceride levels and pre-eclampsia in both second and third trimesters (figure 1).
|
Outcome |
Trimester |
Mean |
N |
SD |
SEM |
95 % CI |
|
|
Lower Bound |
Upper Bound |
||||||
|
Preeclampsia |
Second Trimester |
204.00 |
20 |
18.90 |
4.23 |
195.71 |
212.29 |
|
Third Trimester |
243.20 |
20 |
15.58 |
3.48 |
236.37 |
250.03 |
|
|
GDM |
Second Trimester |
214.33 |
6 |
18.64 |
7.61 |
199.42 |
229.25 |
|
Third Trimester |
230.50 |
6 |
17.03 |
6.95 |
216.88 |
244.12 |
|
|
Preterm |
Second Trimester |
212.83 |
6 |
11.99 |
4.90 |
203.24 |
222.43 |
|
Third Trimester |
240.17 |
6 |
7.73 |
3.16 |
233.98 |
246.35 |
|
Figure 1. Association of Triglycerides with Preeclampsia, GDM and Preterm
4.3 Association of Cholesterol with Preeclampsia, GDM and Preterm
The below table (figure 2) indicates the 95% confidence interval for cholesterol levels for patients with outcomes of Eclampsia, GDM and Preterm.
In pre eclamptic patients the mean serum cholesterol levels in second trimester was 210.75 with a SD 24.248 (p =0.320), in third trimester, the mean was 243.60 with a SD of 25.84 (p =0.826). There was no statistical significance observed between serum cholesterol and pre-eclampsia in both second and third trimesters.
Compared to the normal value of 200mg/dl, cholesterol level is raised in normal pregnancy. In pre- eclamptic women cholesterol level is raised more than the values in normal pregnancy.
|
Outcome |
Trimester |
N |
Mean |
SD |
SEM |
95% CI |
|
|
Lower Bound |
Upper Bound |
||||||
|
Preeclampsia |
2nd Trimester |
20 |
210.75 |
24.25 |
5.42 |
199.401 |
222.10 |
|
3rd Trimester |
20 |
243.60 |
25.85 |
5.78 |
231.50 |
255.69 |
|
|
GDM |
2nd Trimester |
6 |
223.50 |
25.16 |
10.27 |
197.09 |
249.90 |
|
3rd Trimester |
6 |
242.83 |
27.14 |
11.08 |
214.35 |
271.31 |
|
|
Preterm |
2nd Trimester |
6 |
213.33 |
20.23 |
8.25 |
192.10 |
234.55 |
|
3rd Trimester |
6 |
243.66 |
27.200 |
11.10 |
215.12 |
272.21 |
|
Figure 2. Association of Cholesterol with Preeclampsia, GDM and Preterm
4.4 Association of HDL – Cholesterol with Preeclampsia, GDM and Preterm
The below table (figure 3) indicates the 95% confidence interval for HDL cholesterol levels for patients with outcomes of Preeclampsia, GDM and Preterm.
In third trimester, the mean serum HDL – Cholesterol (HDL-C) level in normal patients was 42.78 with a SD of 4.31, in pre eclamptic patients the mean was 45.60 with a SD 4.12 Compared to the normal value of 40-60 mg/dl, HDL-Cholesterol level is within normal range in normal pregnancy. In pre-eclamptic women HDL-C level was higher than normal pregnancy but within normal range.
In pre eclamptic patients the mean serum HDL – Cholesterol levels in second trimester was 51.8 with a SD 5.8 (p =0.040), in third trimester, the mean was 45.60 with a SD of 4.1 (p =0.006). There was significant statistical significance observed between serum HDL -Cholesterol and pre-eclampsia in both second and third trimesters.
|
Outcome |
Trimester |
N |
Mean |
SD |
SEM |
95% CI |
|
|
Lower Bound |
Upper Bound |
||||||
|
Preeclampsia |
2nd Trimester |
20 |
51.80 |
5.84 |
1.30 |
49.06 |
54.53 |
|
3rd Trimester |
20 |
45.60 |
4.12 |
.92 |
43.67 |
47.52 |
|
|
GDM |
2nd Trimester |
6 |
52.00 |
7.07 |
2.88 |
44.57 |
59.42 |
|
3rd Trimester |
6 |
41.16 |
7.27 |
2.97 |
33.52 |
48.80 |
|
|
Preterm |
2nd Trimester |
6 |
49.00 |
6.13 |
2.50 |
42.56 |
55.43 |
|
3rd Trimester |
6 |
45.50 |
4.03 |
1.64 |
41.26 |
49.73 |
|
Figure 3. Association of HDL – Cholesterol with Preeclampsia, GDM and Preterm
4.5 Association of LDL – Cholesterol with Preeclampsia, GDM and Preterm
The below table (figure 4) indicates the 95% confidence interval for LDL cholesterol levels for patients with outcomes of Preeclampsia, GDM and Preterm.
In third trimester, the mean serum LDL-Cholesterol level in normal patients was 137.80 with a SD of 13.67, in preeclamptic patients the mean was 137.80 with a SD 11.5. Compared to the normal value of 130 mg/dl [5], triglyceride level is raised in normal pregnancy. In preeclamptic women LDL-C level was same as in normal pregnancy (figure 4). In preeclamptic patients the mean serum LDL-C levels in second trimester was 92.7 with a SD 18.2 (p =0.943), in third trimester, the mean was 137.8 with a SD of 11.5 (p =0.996). There was no significant statistical significance observed between serum LDL-C levels and pre-eclampsia in both second and third trimesters.
|
Outcome |
Trimester |
N |
Mean |
SD |
SEM |
95% CI |
|
|
Lower Bound |
Upper Bound |
||||||
|
Preeclampsia |
2nd Trimester |
20 |
92.70 |
18.22 |
4.07 |
84.17 |
101.23 |
|
3rd Trimester |
20 |
137.80 |
11.59 |
2.59 |
132.37 |
143.22 |
|
|
GDM |
2nd Trimester |
6 |
96.83 |
31.39 |
12.81 |
63.89 |
129.77 |
|
3rd Trimester |
6 |
150.16 |
9.88 |
4.03 |
139.79 |
160.54 |
|
|
Preterm |
2nd Trimester |
6 |
84.50 |
6.12 |
2.50 |
78.07 |
90.92 |
|
3rd Trimester |
6 |
127.83 |
10.64 |
4.34 |
116.66 |
139.00 |
|
Figure 4. Association of LDL – Cholesterol with Preeclampsia, GDM and Preterm
4.6 Association of VLDL – Cholesterol with Eclampsia, GDM and Preterm
The below table (figure 5) indicates the 95% confidence interval for VLDL cholesterol levels for patients with outcomes of Eclampsia, GDM and Preterm.
In third trimester, the mean serum VLDL-Cholesterol (VLDL-C) level in normal patients was 35.88 with a SD of 6.5, in pre eclamptic patients the mean was 39.7 with a SD 7.1. Compared to the normal value of 35 mg/dl [5], VLDL-C level is raised in normal pregnancy. In pre- eclamptic women VLDL-C level was increased more than that in normal pregnancy.
In pre eclamptic patients the mean serum VLDL-C levels in second trimester was 30.9 with a SD 7.9 (p =0.93), in third trimester, the mean was 39.7 with a SD of 7.1 (p =0.016). There was no significant statistical significance observed between serum VLDL-C levels and pre-eclampsia in second trimester but significance was found in third trimesters.
|
Outcome |
Trimester |
N |
Mean |
SD |
SEM |
95% CI |
|
|
Lower Bound |
Upper Bound |
||||||
|
Eclampsia |
2nd Trimester |
20 |
30.95 |
7.93 |
1.77 |
27.23 |
34.66 |
|
3rd Trimester |
20 |
39.70 |
7.11 |
1.59 |
36.36 |
43.03 |
|
|
GDM |
2nd Trimester |
6 |
27.16 |
6.01 |
2.45 |
20.85 |
33.47 |
|
3rd Trimester |
6 |
34.00 |
5.65 |
2.30 |
28.06 |
39.93 |
|
|
Preterm |
2nd Trimester |
6 |
25.66 |
3.98 |
1.62 |
21.48 |
29.84 |
|
3rd Trimester |
6 |
36.83 |
6.96 |
2.84 |
29.52 |
44.14 |
|
Figure 5. Association of VLDL – Cholesterol with Eclampsia, GDM and Preterm
4.7 Mean values of lipid parameters with outcome in 2nd and 3rd trimester
The mean values of Serum cholesterol, Serum TG, HDL-C, LDL-C, VLDL-C are given in figures 6 and 7.
|
Trimester |
Outcome |
Serum Cholesterol {mg/dl} |
Serum Triglycerides {mg/dl} |
HDL-CHOLESTEROL {mg/dl} |
LDL-CHOLESTEROL {mg/dl} |
VLDL-CHOLESTEROL {mg/dl} |
|
Second Trimester |
Preeclampsia |
210.75 |
204.00 |
51.80 |
92.70 |
30.95 |
|
GDM |
223.50 |
214.33 |
52.00 |
96.83 |
27.16 |
|
|
Preterm |
213.33 |
212.83 |
49.00 |
84.50 |
25.66 |
|
|
Third Trimester |
Preeclampsia |
243.60 |
243.20 |
45.60 |
137.80 |
39.70 |
|
GDM |
242.83 |
230.50 |
41.16 |
150.16 |
34.00 |
|
|
Preterm |
243.66 |
240.16 |
45.50 |
127.83 |
36.83 |
Figure 6. Mean values of lipid parameters with outcome in 2nd and 3rd trimester
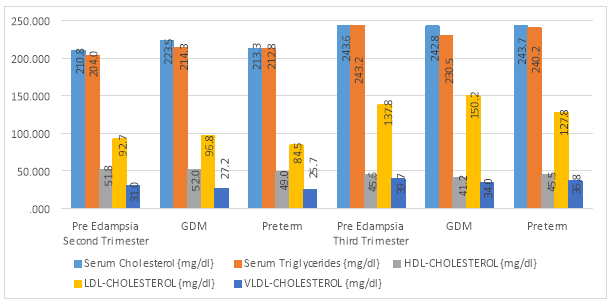
Figure 7. Comparison of Lipid parameters between second and third trimester
4.9 Complications outcome distribution
Out of total 200 patients 168 had no complications, while 20 {10%} had preeclampsia, 6 {3%} had Gestational Diabetes Mellitus and 6 {3%} had preterm deliveries (Figure 8).
|
Complication |
No of Cases |
Percentage |
|
No Complication |
168 |
84% |
|
Pre-eclampsia |
20 |
10% |
|
GDM |
6 |
3% |
|
Preterm |
6 |
3% |
|
Total |
200 |
100% |
Figure 8. Distribution according to Complications
5. Discussion
Hypercholesterolemia is known to cause excessive lipid peroxidation and coexistent diminution in antioxidant activity which may result in an imbalance between peroxidases and antioxidants, leading to oxidative stress. Oxidative stress and elevated atherogenic index may lead to atherogenicity in Pre-eclampsia [6].
5.1 Triglycerides
In a study conducted by Arnon Wiznitzer et. al., to prove the association of lipid levels during gestation with preeclampsia and GDM in 9911 pregnant women, they observed that the composite endpoint (GDM or preeclampsia) occurred in 1209 women (12.2%). During the index pregnancy, GDM was diagnosed in 638 women (6.4%) while Preeclampsia was diagnosed in 625 pregnancies (6.3%) [7].
In a study by Lorentzen et al., it was observed that the mean triglyceride concentrations of pre-eclampsia patients were higher than normal pregnant women at 16-18 weeks [8].
Later, a large prospective cohort study conducted in Norway by Clausen et al. (2001) also demonstrated that women with triglycerides above 212 mg/dL (2.4 mmol/L) had a five-fold increased risk (95% CI 1.1-23.1) of early onset pre-eclampsia (onset before 34 weeks) compared with those with triglycerides levels 133 mg/dL [9].
A study done by S. Niromanesh et. al., to compare the outcomes of forty five pregnant women who had high TG levels (>195 mg/dl) with 135 pregnant women having TG levels <195 mg/dl. The important outcome measures were the incidence of preterm birth, gestational diabetes, pre-eclampsia and uterine artery pulsatility index. Eight women with high triglyceride levels had preeclampsia (17.8% v. 3.7% in the control group, p<0.004), preterm birth occurred in 24.4% and 5.9% in the high triglyceride group and the control group, respectively (OR 5.1, 95% CI 1.9-13.8, p<0.0001). The incidence of gestational diabetes in the high triglyceride group was significantly higher than that in the control group. They conclude a positive relation between hyper triglyceridaemia and pre-eclampsia, preterm birth and gestational diabetes [10].
In a study done by Kandimalla et. al., comprising 156 pregnant women attending antenatal clinic visits were included prior to 20 weeks and were analysed for lipid levels. 102 participants were followed until delivery and were monitored for pre-eclampsia. They reported that mean triglyceride levels were found significantly higher in the pre-eclampsia group. Women with triglycerides above 130 mg/dL had increased risk of pre-eclampsia compared with those with triglycerides levels of 91 mg/dL or less [11].
In the present study, compared to the normal value of 150 mg/dl [12], during second trimester, the 95% CI for triglyceride level with Preeclampsia was between 195.71 and 212.29, the 95% CI for triglyceride level with outcome GDM was between 199.42 and 229.25; while the 95 % CI for triglyceride with preterm outcome was between 203.24 and 222.43. Hence, we can conclude that triglyceride level of more than 195 mg/dl during second trimester can lead to complications like Preeclampsia, and triglycerides greater than 199.42mg/dl lead to GDM and levels above 203.24mg/dl lead to Preterm delivery. During third trimester, the 95% CI for triglyceride level with Preeclampsia was between 236.37 & 250.03, the 95% CI for triglyceride level with outcome GDM was between 216.88 & 244.12 and the 95 % CI for triglyceride with preterm outcome was between 233.98 and 246.35. Hence, we can conclude that triglyceride level of more than 236 mg/dl during second trimester can lead to complications like Preeclampsia, triglyceride level of more than 216.88 mg/dl leads to GDM and triglyceride level of more than 233.98mg/dl leads to Preterm delivery (figure 1). Our findings correlate with the findings of a study done by Kandimalla et. al [11].
5.2 Cholesterol
In a case control study by Gratacos et al., (1996), the total cholesterol levels were not significantly elevated in pre-eclampsia patients but triglyceride levels were significantly increased from 10 weeks [13]. Our results correlate with the a study done by Arnon Wiznitzer et al., where they concluded high triglyceride levels were associated with development of gestational diabetes [7]. According to the study done by Usha et al., it was concluded that hypercholesterolemia leads to atherogenicity in Pre-eclampsia [14].
In the present study, during second trimester, the 95% CI for cholesterol level with Preeclampsia was (199.40, 222.09), the 95% CI for cholesterol level with outcome GDM was between 197.09 & 249.91 and the 95 % CI for cholesterol with preterm outcome was between 192.11 & 234.56. Hence, we cannot predict the occurrence of preeclampsia, GDM and preterm delivery based on cholesterol levels of second trimester as the lower bound value is within the normal range. During third trimester, the 95% CI for cholesterol level with Preeclampsia was between 231.50 & 255.69, the 95% CI for cholesterol level with outcome GDM was between 214.35& 271.32 and the 95 % CI for cholesterol with preterm outcome was between 215.13 & 272.21 (figure 2).
Hence, we can conclude that cholesterol level of more than 231.5 mg/dl during second trimester can lead to complications like Preeclampsia, and cholesterol level of 214.35 may lead to GDM and a level above 215.12 mg/dl may lead to Preterm delivery (figure 2).
5.3 HDL-C
In their study, Kandimalla et. al., reported that mean HDL-C levels were found lower in the pre-eclampsia group [11]. In a study done by Wakatsuki, A et al., the levels of HDL-C did not differ significantly between pre-eclamptic women and normal pregnant women [15]. There were other studies too, which showed decrease in HDL-C levels during pregnancy [14,16-18].
In the present study, during second trimester, the 95% CI for HDL-C level with Preeclampsia was between 49.06 & 54.53, the 95% CI for HDL cholesterol level with outcome GDM was between 44.58 & 59.42 and the 95 % CI for HDL cholesterol with preterm outcome was between 42.56 & 55.43. Hence, we cannot predict the occurrence of preeclampsia, GDM and preterm delivery based on HDL – Cholesterol levels of second trimester as the lower bound value and mean are within the normal range. During third trimester, the 95% CI for HDL cholesterol level with Preeclampsia was between 43.67 & 47.52, the 95% CI for HDL cholesterol level with outcome GDM was between 33.53 & 48.80 and the 95 % CI for HDL cholesterol with preterm outcome was between 41.26 & 49.74.
Hence, we cannot predict the occurrence of preeclampsia, GDM and preterm delivery based on HDL – C levels of third trimester as the lower bound value and mean are within the normal range (figure 3).
5.4 LDL-C
Kandimalla et. al., reported mean LDL-C levels were found significantly higher in the pre-eclampsia group [11].
In the present study, during second trimester, the 95% CI for LDL cholesterol level with Preeclampsia was between 84.17 & 101.23, the 95% CI for LDL cholesterol level with outcome GDM was between 63.89 & 129.78 and the 95 % CI for LDL cholesterol with preterm outcome was between 78.07 & 90.93. Hence, we cannot predict the occurrence of preeclampsia, GDM and preterm delivery based on LDL – Cholesterol levels of second trimester as the lower bound value and mean are within the normal range (figure 4).
During third trimester, the 95% CI for LDL cholesterol level with Preeclampsia was between 132.37 & 143.22, the 95% CI for LDL cholesterol level with outcome GDM was between 139.79 & 160.54 and the 95 % CI for LDL cholesterol with preterm outcome was between 116.66 & 139.00. Hence, we cannot predict the occurrence of preeclampsia, GDM and preterm delivery based on LDL – Cholesterol levels of third trimester as the lower bound value and mean are within the normal range (figure 4).
5.5 VLDL-C
During second trimester, the 95% CI for VLDL cholesterol level with Eclampsia was between 27.24 & 34.67, the 95% CI for VLDL cholesterol level with outcome GDM was between 20.86 & 33.48 and the 95 % CI for LDL cholesterol with preterm outcome was between 21.49 & 29.85. Hence, we cannot predict the occurrence of preeclampsia, GDM and preterm delivery based on VLDL – Cholesterol levels of second trimester as the lower bound value and mean are within the normal range.
During third trimester, the 95% CI for VLDL cholesterol level with Eclampsia was between 36.37 & 43.03, the 95% CI for VLDL cholesterol level with outcome GDM was between 28.06 & 39.94 and the 95 % CI for VLDL cholesterol with preterm outcome was between 29.52 & 44.15. Hence, we cannot predict the occurrence of preeclampsia, GDM and preterm delivery based on VLDL – Cholesterol levels of second trimester as the lower bound value and mean are within the normal range (figure 5). Our findings correlate with the findings of a study done by Kandimalla et. al [11].
Furthermore, high fats and sugar levels may lead to HTN as well [16].
This study findings were similar to the results of these researchers despite confounding variables such as ethnicity. Our data suggest that the alteration of the lipoprotein metabolism, especially increased triglyceride levels plays a role in the development of pre-eclampsia. Because of its early presentation, hyper-triglyceridemia can be a useful early predictor of pre-eclampsia risk. This may help in developing the effective early preventive or therapeutic measures.
The strengths of the present study are its prospective nature, assessment of lipid levels in early gestation. Application of strict selection criteria. Some of the limitations are single-centre based studying, small number of pre-eclampsia patients, and the non-availability of reference serum lipid values in the local population. The way forward will therefore be to conduct larger prospective multicentre studies.
6. Conclusion
An association between maternal early pregnancy triglyceridaemia, and the subsequent risk of pre-eclampsia, gestational diabetes and preterm deliveries was observed. Triglycerides greater than 195mg/dl in second trimester & 236mg/dl in third trimester predispose pregnant females to develop preeclampsia. Triglycerides greater than 199mg/dl in second trimester & 216mg/dl in third trimester predispose pregnant females to develop Gestational Diabetes. Triglycerides greater than 203mg/dl in second trimester & greater than 233mg/dl in third trimester predispose pregnant females to have preterm deliveries.
Occurrence of Preeclampsia, Gestational Diabetes and Preterm deliveries cannot be predicted based on the values of Serum Cholesterol, HDL-Cholesterol, LDL-Cholesterol and VLDL-Cholesterol. FBS greater than 101mg/dl & PGBS greater than 143mg/dl predispose pregnant females to develop Gestational Diabetes.
Hence estimation of lipid profile is strongly recommended as part of the laboratory investigation during pregnancy so as to institute prompt management strategies to prevent deleterious effect of hyperlipidaemia associated with pregnancy.
7. References
- Mankuta D, Elami-Suzin M, Elhayani A, Vinker S. Lipid profile in consecutive pregnancies. Lipids in health and disease. 2010 5;9(1):1.
- Freinkel N. Effect of the conceptus on maternal metabolism during pregnancy. Excerpta Medica. 1964;12:679-81.
- Hollander MH, Paarlberg KM, Huisjes AJ. Gestational diabetes: a review of the current literature and guidelines. Obstet Gynecol Surv. 2007;62(2):125-36.
- Frishman WH, Veresh M, Schlocker SJ, et al. Pathophysiology and medical management of systemic hypertension in preeclampsia. Curr Hypertens Rep. 2006;8(6):502-11.
- Pusukuru R, Shenoi AS, Kyada PK, Ghodke B, Mehta V, Bhuta K, Bhatia A. Evaluation of lipid profile in second and third trimester of pregnancy. Journal of clinical and diagnostic research: JCDR. 2016 Mar;10(3):QC12.
- Al-Azzawie HF, Sahib DF. Relationship between Lipid per oxidation, Leptin and Lipid Profile in Iraqi Women with Preeclampsia. Eng. & Tech. Journal. 2014;32(2);225-37. Available from: http://www.iasj.net/iasj?func=fulltext&aId=102319.
- Wiznitzer A, Mayer A, Novack V, Sheiner E, Gilutz H, Malhotra A, Novack L. Association of lipid levels during gestation with preeclampsia and gestational diabetes mellitus: a population-based study. American journal of obstetrics and gynecology. 2009 Nov 30;201(5):482-e1.
- Lorentzen B, Endresen M, Clausen T, Henriksen T. (1994). Fasting serum free fatty acids and triglycerides are increased before 20 weeks of gestation in women who later develop preeclampsia. Hypertens Pregnancy 13:103-9.
- Clausen T, Djurovic S, Henriksen T. Dyslipidemia in early second trimester is mainly a feature of women with early onset preâ€eclampsia. BJOG: An International Journal of Obstetrics & Gynaecology. 2001 Oct 1;108(10):1081-7.
- Niromanesh S, Shirazi M, Dastgerdy E, Sharbaf FR, Khazaeipour Z. Association of hypertriglyceridaemia with pre-eclampsia, preterm birth, gestational diabetes and uterine artery pulsatility index. The National medical journal of India. 2011 Dec;25(5):265-7.
- Kandimalla BH, Sirjusingh A, Nayak BS, Maiya SS. Early antenatal serum lipid levels and the risk of pre-eclampsia in Trinidad and Tobago. Archives of physiology and biochemistry. 2011 Oct 1;117(4):215-21.
- Jellinger PS, Smith DA, Mehta AE, et al. AACE Task Force for Management of Dyslipidemia and Prevention of Atherosclerosis. American Association of Clinical Endocrinologists’ Guidelines for Management of Dyslipidemia and Prevention of Atherosclerosis. Endocr Pract. 2012 Mar-Apr;18 Suppl 1:1-78.
- Gratacos E, Casals E, Sanllehy C, Cararach V, Alonso PL, Fortuny A. (1996). Variation in lipid levels during pregnancy in women with different types of hypertension. Acta Obstet Gynecol Scand 75:896-901.
- Adiga U, D’souza V, Kamath A, et al. Antioxidant activity and lipid peroxidation in preeclampsia. J Chin Med Assoc. 2007 Oct;70(10):435-8.
- Wakatsuki A, Ikenoue N, Okatani Y, et al. Lipoprotein particles in preeclampsia: susceptibility to oxidative modification. Obstet Gynecol. 2000 Jul;96(1):55-9.
- Rubina Aziz, Tabassum Mahboob. Pre-Eclampsia and lipid profile: Pak J Med Sci: 2007:23(5):751-4
- Koçyigit Y, Atamer Y, Atamer A, et al. Changes in serum levels of leptin, cytokines and lipoprotein in pre-eclamptic and normotensive pregnant women. Gynecol Endocrinol. 2004 Nov;19(5):267-73.
- Belo L, Caslake M, Gaffney D, et al. Changes in LDL size and HDL concentration in normal and preeclamptic pregnancies. Atherosclerosis. 2002 Jun;162(2):425-32.
- Mehta V. Emergence of New Risk Factors for causing Hypertension. Journal of Medical Research and Innovation. 2017 Jan 6;1(1):9-11.