Coca-Cola Amatil Limited Management
Introduction
The soft drink manufacturing industry is one of the largest industries around the globe. In Australia, it is one of the greatest revenue generators, estimated at $4bn as of 2016 according to the ibisworld.com 2016 report (IBISWorld.com, 2016 P. 1). The major players in the industry in Australia are Coca-Cola Amatil Limited and Asahi Holdings. The aim of this paper is to analyze and evaluate the performance of Coca-Cola Amatil Limited by first looking at the overview of the company itself.
Overview of the Company
Management and directors of the company
The management of Coca-Cola Amatil Limited comprises of the Board of Directors and the group leadership team. The Chief Executive Officer, officially known as the group managing director, Ms. Alison Watkins (CCA, P.1) is both on the board of directors and the leadership team.
The board of directors comprises of the Chairman, Mr. David Gonski, and the CEO (CCA, P. 1). The Chairman is a non-executive director.
The other non-executive directors include the following:
ï¶ Ilana Atlas, Non-Executive Director (Independent)
ï¶ John Borghetti, Non-Executive Director (Independent)
ï¶ Anthony (Tony) Froggatt, Non-Executive Director (Independent)
ï¶ Martin Jansen, Non-Executive Director
ï¶ Mark Johnson, Non-Executive Director (Independent)
ï¶ Wal King, AO Non-Executive Director (Independent)
ï¶ David Meiklejohn, AM Non-Executive Director (Independent)
ï¶ Ms. Catherine Brenner, Non-Executive Director
ï¶ Paul O’Sullivan, Non-Executive Director (Independent)
ï¶ Krishnakumar Thirumalai, Non-Executive Director (Nominee of TCCC) (CCM, 2016)
The management team consists of the Group managing director, Ms. Alison Watkins, and the following:
- Mr. Reg Weine, Managing Director SPC
- Mr. Barry O’Connell, Managing Director, Australian Beverages
- Mr. Kadir Gunduz, Managing Director, Indonesia & PNG
- Mr. Shane Richardson, Managing Director, Alcohol & Coffee
- Mr. Chris Litchfield, Managing Director, New Zealand & Fiji
- Ms. Libbi Wilson, Group Human Resources Director
- Ms. Betty Iyanoff, Group General Counsel
- Ms. Katie Newton-John, Joint Company Secretary
- Mr. James Lane, Sales Director
- Ms. Liz McNamara, Group Head of Public Affairs and Communications
- Mr. Simon Edgar, Director Marketing, and Strategy
- Mr. Chris Sullivan, Chief Procurement Officer
- Mr. Warwick Hutton, Chief Information Officer
- Mr. Andrew Wilson, General Manager-Strategy, Planning & Innovation
- Mr. Davis Akers, Head of Investor Relations
- Ms. Kate Mason, Chief Transformation Officer (ibisworld.com, 2016)
Major shareholders (holding at least 5% of shares)
Coca-Cola Amatil Limited is a public limited company in Australia (IBISWorld.com, 2016 P. 1). According to IBISWorld.com, (2016), the major shareholders are the following:
- Coca-Cola Holdings Ltd of the United States of America, with a percentage shareholding of 29.21
- HSBC Custody Nominees Limited (Australia) with a share of 18.65%
- JP Morgan Nominees Australia Limited with 10.05% shareholding
- National Nominees Limited (Australia) with 8.54% shareholding
- Citicorp Nominees Pty Limited with 5.93% shareholding.
Compensation of Directors and Top Executives
The company has a remuneration committee that is responsible for setting out the remuneration of all employees. The committee has set favourable compensation incentive plans that are performance based; a key management who performs better is likely to earn more on top of the fixed remuneration. According to the CCA Annual Report (2015, P. 62), the compensation of key management personnel was as follows;
A.M. Watkins, the Group Managing Director, had a fixed compensation which included Salary and leaves entitlements amounting to $2,263,266, non-monetary benefits of $450, superannuation of base salary of $19,046 and another amount of $7,720. The manager was also able to take at-risk performance related compensation which amounted to $1,564,500 (Coca-Cola Amatil Annual Report, 2015, P. 62). The Group Chief Financial Officer, Mr. M.J. Robert had a fixed salary of $1,810,083 and non-monetary benefits of $258. He also received a superannuation of base salary amounting to $9,654 (CCA Annual Report, 2015, P. 62). He was also entitled to at-risk performance-related compensation of $267,027 (CCA Annual Report, 2015, P. 62). The Group Human Resources Director, E.C Wilson, was entitled to a fixed salary of $620,987 and non-monetary benefits of $36,562 (CCA Annual Report, 2015, P. 62). The Managing Director of Indonesia & PNG was entitled to a fixed salary of $719,674 and non-monetary benefits of $432,970, and a risk allowance of $ 371, 626 (CCA Annual Report, 2015, P. 62). The managing director of New Zealand and Fiji was entitled to a fixed salary of $341, 440 and non-monetary benefits of $5,254 with risk allowance of $316,269 (CCA Annual Report, 2015, P. 62). The managing director of Australian Beverages, on the other hand, was entitled to a fixed salary of $939,462 and non-monetary benefits of $118,222 with a risk allowance of $491,447 (CCA Annual Report, 2015, P. 62).
Key performance Indicators (accounting and market)
Coca-Cola Amatil Limited, being the largest company in the Asia Pacific in the soft drinks industry, has several key performance indicators which serve as the basis for its business decisions. According to ibisworld.com (2016), the Accounting Key Performance Indicators include:
- The Return on Revenue percentage
- Percentage Return on Shareholders’ Funds
- Percentage Return on Assets
- Percentage Profit Margin
- The Revenue per Employee
- The Net Profit after Tax (NPAT) per Employee
- The percentage Effective Tax Rate
- The Percentage Gearing
- The Interest Cover
- The Current Ratio
- The Dividends paid per Share
The Marketing Key Performance Indicators are:
- The percentage change of Total Revenue Growth
- The percentage change in Sales Revenue Growth
- The Percentage change in Total Assets
- The percentage change in the Net Profit After Tax
- The percentage change in Earnings Before Interest, Tax, Depreciation and Amortization (EBITDA)
- The percentage change in Shareholder’s Funds
Evaluation of the performance of Coca-Cola Amatil Limited
Coca-Cola Amatil Limited is one of the major players in the Soft Drink Manufacturing Industry in Australia. The industry’s retail market has been hit by changing customer preferences of soft drink which has led to a significant drop in revenue. However, the growth in popularity of energy and sports drinks has spearheaded the growth of the industry. According to IBISWorld.com (2016), the industry revenue has been projected to increase at an annual rate of 2.4% for the next five years through 2015-2016.
In Australia, the company is ranked position 72 in the top 2000 companies. The primary source of income of the company is from the manufacture of beverage and tobacco in the Australia industry. According to ibisworld.com (2016), Coca-Cola Amatil Limited is reported to have generated total revenue of $5.253 billion in the year ending 2016. The company operates in two groups namely: Non-Alcoholic beverages, and Alcoholic, Food, and Services.
Under the Non-Alcoholic Beverage segment, the company manufactures and distributes the Coca-Cola licensed products in five Asia Pacific countries which are Australia, New Zealand, Fiji, Papua New Guinea and Indonesia (IBISWorld.com, 2016). For the purpose of evaluation, the report will cover the various segments in which Coca-Cola Amatil Limited operates.
Spirit Manufacturing in Australia
In 2007, CCA started to venture into the alcoholic beverage market after signing a 10 year deal with Beam Global Spirits and Wines Inc and executing it as a joint venture with SABMiller (IBISWorld.com, 2016). As of 2016, the number of companies in the industry is 71 with a turnover growth rate of 1.31 and a size of $1.7831 billion (IBISWorld.com, 2016). Coca-Cola Amatil Limited has an estimated market share of 15.3% in this industry (IBISWorld.com, 2016).
Over the past five years, from 2012 to 2017, CCA’s alcoholic segment has been performing well despite a reduced consumption which has slowed growth rate. According to IBISWorld.com (2016), CCA’s revenue in this industry is expected to increase at an annual rate of 3.3% through December 2017. The primary competitors are Diageo Australia Limited and Asahi Holdings (Australia) Pty Limited. Diageo and Asahi Holdings have market shares of 23.6% and 12.3% respectively, implying that Diageo is the market leader followed by CCA.
Fruit and Vegetable Processing in Australia
The company ventures in the fruit and vegetable processing through its subsidiary company called SPC Ardmona (IBISWorld.com, 2016). The subsidiary processes a broad range of fruits and vegetable products for sale in various retail stores. The company’s performance in this segment has been hampered by cheap imports from South Africa and Italy (IBISWorld.com, 2016). There has also been a competition between the major supermarkets such as Woolworths and Coles, which has also led to the reduction in prices of the products. The industry size is estimated to be $5.8864 billion with a turnover growth rate of 0.29. CCA has a market share of 5.7%. Other players in the Industry are Simplot Australia Pty Limited and Heinz Wattie’s Pty Limited with market shares of 8.1% and 6.6% respectively (IBISWorld.com, 2016).
Coca-Cola Amatil has been struggling to cope with the competition over the past five years. Generally, it has been underperforming due to oversupply from cheap imports. Extreme weather has also affected the company since it has reduced fresh produce. In 2013, the total revenue was 319.8, up from 317.2 in 2012. There was also an increase in 2014, but the revenue decreased in 2015 which was recorded to be 319.6 down from 328.1 in 2014. The revenue in 2016 rose to 332.4.
Soft Drink Manufacturing
Coca-Cola Amatil boasts being the largest soft drink manufacturer in Australia with a market share of 53.8% (ibisworld.com, 2016). Its rival, Asahi Holdings Pty Limited has a market share of 24.9%. Historically, the performance of CCA has been strong. However, high competition and shift of customer’s preference of soft drinks due to health concerns have significantly affected the revenue. Despite being the market leader in the industry, CCA has been underperforming over the last five years. The company’s revenue has been falling due to pressures from competitors and marketing costs. According to IBISWorld report (2016), the revenue increased between 2011 and 2012. From 2012 to 2016, the profits have sharply decreased.
Overall Company Performance
In overall, CCA has been performing relatively well considering the fact that its main business segment has the highest market share in Australia.
Sales Revenue
According to Saunders & Cornett (2014), sales revenue refers to the net income from the sales of goods or services after all the costs have been subtracted. Over the last five years, CCA has been recording an unstable growth in sales revenue. As at December 2012, the sales revenue was $5,097,400. This was followed by a drop in 2013 which recorded sales revenue of $5,036,400, a growth rate of -1.2%. In 2014, the sales revenue grew at a rate of -1.9% to $4,942,800. This was the lowest figure in the span of five years. In 2015, CCA did a lot to achieve high sales revenue of %5,093,600,000 which is equivalent to a growth rate of 3.1%. In 2016, the sales revenue changed positively at a rate of 1.1% to record a figure of $5,150,800,000 (ibisworld.com, 2016). Although the sales growth rate seems to be staggering, the average growth of sales revenue from 2011 to 2016 is 1.4%.
Total Revenue
Saunders & Cornett (2014) define total revenue as the income of a company from all sources, including the sales revenue, in a given period. The figure includes the sales revenue and revenue from other sources. Just like the sales revenue, CCA has had unstable total revenue since 2012. The company recorded $5.175 billion of total revenue in 2012 (ibisworld.com, 2016). In 2013, the total revenue dropped by 1.1% to record $5.1199 billion (ibisworld.com, 2016). In the following year, a further decline in total revenue was also realized, at a staggering figure of $5.0341 billion, which was a drop by 1.7% (ibisworld.com, 2016). In 2015, CCA’s total revenue increased at a rate of 3% to become $5.1869 billion by the end of the year (ibisworld.com, 2016). By the end of 2016, the total revenue was recorded as $5.2532 billion, which was an increase of 1.3% from the previous year. On average, the percentage change in growth rate since 2011 is 1.5%, implying that the company is on the right track. However, comparing to the average growth rate in the industry which was 2.36% in 2016, the company has been underperforming.
Net Profit after Tax (NPAT)
Net Profit after Tax (NPAT) is the amount of money a company earns after all its expenses (Saunders & Cornett, 2014). Coca-Cola Amatil Limited has been hit by fluctuations in profits, and its profits have generally been decreasing sharply from 2012 to date. In 2012, the net profit after tax was $457.8 million. This was followed by a sharp decrease in 2013, which was $79.9 million, which is a percentage decrease of 82.5% (ibisworld.com, 2016). In 2014, the profits increased more than twice and reached $272.1 million, which is 240.6% growth. The profits grew further by 44.6% in 2015 but, as of 2016 December, the profit was $246.1 million as opposed to $393.4 million in 2015, which was a decrease of 37.4% (ibisworld.com, 2016). On average, CCA has not been doing well regarding profits. Its average change in NPAT is -16.1%. As of December 2016, the industry average NPAT was 4.99%, implying that CCA has been performing poorly.
Return on Revenue (ROR)
To understand the profitability of CCA, it is essential to look at the change in ROR. In 2012, the change in ROR was 8.9% (ibisworld.com, 2016). In 2013, 2014, 2015 and 2016, the ROR was 1.6%, 5.4%, 7.6% and 4.7% respectively (IBISWorld.com, 2016). This implies that the company was more profitable in 2012 and 2015 compared to the rest of the years.
Return on Assets (ROA)
The ROA measures the profitability of a company in relation to its assets. CCA has been doing well since it has been recording a positive ROA since 2012. Coca-Cola Amatil Limited management team can be said to be efficient in utilizing assets to generate revenue. From 2012 to 2016, the Return on Assets is 6.8%, 1.2%, 4.5%, 5.9%, and 3.8% respectively. The average ROA in the industry as at 2016 was 1.9% compared to CCA’s 3.8% (IBISWorld.com, 2016). The company has, therefore, been performing well in the industry.
Question 2
Robert Alba just won the state lottery. He has been given the option of receiving either
$62.9 million today or $5 million a year for the next 35 years, with the first payment paid
today. Discuss the process that Robert should use to determine which payment option he
prefers. Ignore all taxes and assume that Jesse will live for at least 40 more years
Solution
To determine the best option, we need to determine the present value the Annuity due of for the given cash flows since the payment in the second option is going to be made at the beginning of the period. Present value or the discounted value refers to the current worth of the given amount of money or the stream of cash flow that is going to be received in future at a particular rate of return (Brealey, Myers, Allen, and Mohanty, 2012). The present value is usually less than the future value due to the time value of money characteristic, which states that money will always earn an interest; therefore, a dollar today is more than a dollar tomorrow.
The formula is as follow;
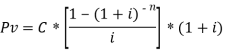 (Brealey, Myers, Allen, and Mohanty, 2012)
Where C=the cash given per period
i = rate of interest
n= the number of payments
In this case, the present value of $62.9 million today is $62.9 million. Robert Alba should determine the present value of the cumulative cash flows of $5 million per year for 35 years. The best option would be that with the highest present value.
Using the formula above, the present value for option B will be as follow;
Assuming a uniform interest rate of 10%,
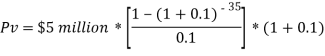

$53.04 million is less than $62.9 million; therefore, Robert Alba should choose option A, i.e. to receive the payment of $62.9 million now.
List References
Brealey, R.A., Myers, S.C., Allen, F. and Mohanty, P., 2012. Principles of corporate finance. Tata McGraw-Hill Education.
CCA Annual Report, 2015. Real Possibilities Real Progress-2015 Annual Report. Accessed on https://www.ccamatil.com/-/media/Cca/Corporate/Files/Annual-Reports/2015/CCA166-CCA-Annual-Report-2015-WEB_final.ashx
CCA, n.d. Coca-Cola Amatil Limited. Accessed on https://www.ccamatil.com
IBISWorld.com, 2016. IBISWorld Company Premium Report: Coca-Cola Amatil Limited. Balance Date: 2016
Saunders, A. and Cornett, M.M., 2014. Financial institutions management. McGraw-Hill Education.