Coincidence of Cycles in Credit and Property Markets
Abstract
 What caused the financial crisis that is sweeping across the world? What is the role of debt and leverage in causing asset market bubbles to form and collapse? What keeps asset prices and lending depressed? What can be done to remedy matters? This paper will present a qualitative review of the role of debt and leverage in causing asset market bubbles to form and collapse in the real estate market under the context of the global financial crisis. Long-run causality appears to go from property prices to bank lending.
- Literature Review
- The direction of causality between bank lending and property prices
 The causality between bank lending and property prices goes in both directions. Property prices may affect bank lending via various wealth effects (Hofmann, 2003). First, due to financial market imperfections, households and firms may be borrowing constrained. As a result, households and firms can only borrow when they offer collateral, so that their borrowing capacity is a function of their collateralisable net worth. Since property is commonly used as collateral, property prices are therefore an important determinant of the private sector’s borrowing capacity. Second, a change in property prices may have a significant effect on consumers’ perceived lifetime wealth, inducing them to change their spending and borrowing plans and thus their credit demand in order to smooth consumption over the life cycle. Finally, property prices affect the value of bank capital, both directly to the extent that banks own assets, and indirectly by affecting the value of loans secured by property. Property prices therefore influence the risk-taking capacity of banks and thus their willingness to extend loans. The literature in the last few decades referred to risk-taking behavior of financial market participants in times of abundant liquidity, banks’ leverage targeting behavior and a portfolio real balance effect of other financial intermediaries. Financial intermediaries, which must maintain an adequate ratio of capital to assets, can be deterred from lending, or induced to shift the composition of loans away from bank-dependent sectors such as small businesses, by declines in the values of the assets they hold (Bernanke & Gertler, 2000).
 Bank lending, on the other hand, may affect property prices through various liquidity effects. The price of property can be seen as an asset price, which is determined by the discounted future stream of property returns. An increase in the availability of credit may lower interest rates and stimulate current and future expected economic activity. As a result, property prices may rise because of higher expected returns on property and a lower discount factor. Property can also be seen as a durable good in temporarily fixed supply. An increase in the availability of credit may increase the demand for housing if households are borrowing constrained. With supply temporarily fixed because of the time it takes to construct new housing units, this increase in demand will be reflected in higher property prices.
 This potential two-way causality between bank lending and property prices may give rise to mutually reinforcing cycles in credit and property markets. A rise in property prices, caused by more optimistic expectations about future economic prospects, raises the borrowing capacity of firms and households by increasing the value of collateral. Part of the additional available credit may also be used to purchase property, pushing up property prices even further, so that a self-reinforcing process may evolve. Potential simultaneity problems are controlled for the direction of causality between bank lending and property prices, as studied by Gerlach and Peng (2002).
 Bank lending, which was transformed into real terms by deflation with the CPI (consumer price index), is defined as total credit to the private non-bank sector. Cross-country comparisons of the development of bank lending are flawed by differences in the definition of total credit across countries. These differences in definition will be reflected in the results of the empirical analysis. Differences exist, for example, with respect to the treatment of non-performing loans (NPLs) in national credit aggregates. A drop in property prices will on the one hand have a negative effect on the extension of new loans. On the other hand, it will give rise to an increase in NPLs. The estimated effect of property prices on bank lending will therefore depend on whether banks are forced to write off NPLs quickly or not. For instance, Japan and the Nordic countries (Denmark, Finland, Iceland, Norway and Sweden) experienced severe banking crises in the late 1980s or early 1990s, which were preceded by a collapse in property prices. While NPLs were quite quickly cleansed from banks’ balance sheets in the Nordic countries, this was not the case in Japan. To a broader view, bank lending has contributed significantly to the real estate bubble in Asia prior to the 1997 East Asian crisis.
 Quarterly residential property price indices were available for all countries except for Japan, Italy and Germany. For Japan and Italy, semi-annual indices were transformed to quarterly frequency by linear interpolation. For Germany, a quarterly series was generated by linear interpolation based on annual observations from the first quarter of each year. In order to obtain a measure of real property prices, nominal property prices were deflated with the CPI. Residential property prices may not fully capture the property price developments, which are relevant for aggregate bank lending. Credit aggregates comprise bank lending to households and enterprises. The appropriate measure of property prices for the empirical analysis would therefore be aggregate property price index, comprising both residential and commercial property prices.
 For most countries, the available commercial property price data are available only in annual frequency and represent only price developments in the largest urban area of the country. The use of these data in empirical analysis is therefore quite problematic. In the few countries where high quality commercial property price data are available, such as Japan, Hong Kong and Singapore, residential and commercial property prices are closely correlated, suggesting that residential property prices may act as a proxy for omitted commercial property prices in the empirical analysis.
 The short-term real interest rate is measured as the three months interbank money market rate less four quarter CPI inflation. The short-term real money market rate serves as a proxy for real aggregate financing costs. A more accurate measure would be an aggregate lending rate. Representative lending rates are, however, not available for most countries. Empirical evidence suggests that lending rates are tied to money market rates, implying that money market rates are a valid approximation of financing costs.
- The global financial crisis and debt explosions
 A chain of events, beginning with unexpected losses in the U.S. subprime mortgage market, was destined to bring the global financial system close to collapse and to drag the world economy into recession. In the aftermath of the Global Financial Crisis between 2007 and 2009, economists have paid more attention to the role of debt and leverage in causing asset market bubbles to form and collapse. For instance, the asset price inflation and rising leverage for the United States exemplified nearly all the signs of a country on the verge of a financial crisis-indeed, a severe one. Then, we find that asset market collapses are deep and prolonged.
 Obviously, the transparent global banking system shows that the main cause of debt explosions is not the broadly critically valued costs of bailing out and recapitalizing. In essence, the crucial drivers of debt increases are the inevitable collapse in tax revenues that governments suffer in the wake of deep and prolonged output contractions, as well as often-ambitious countercyclical fiscal policies aimed at mitigating the downturn. Firms’ private investment and asset market valuation are negatively associated with their top lender’s real estate exposure. Global firms have a flexible average and they can get the leverage market, so there is an opportunistic approach about it. The characteristic huge buildups in government debt are driven mainly by sharp falloffs in tax revenue and, in many scenarios, big surges in government spending to fight the recession, declared by Reinhard and Rogoff (2008).
 The rise in real government debt in the three years follows a banking crisis, tending to explode with a rise at an average of 86% in the major post-World II episodes (Reinhard and Rogoff, 2008). Using the money amount of borrowing from the banks is the amount of credit available to the firm. Lang, Ofek, and Stulz (1996) find that future growth and investment are negatively related to leverage, especially for real estate firms with high debt ratios. In the current economic background, the effects of firms’ collateral losses may also depend on firm leverage, with highly leveraged firms investing less owning to more binding borrowing constraints. Hofmann (2003) suggests that property price cycles, reflecting changing beliefs about future economic prospects, drive credit cycles, rather than excessive bank lending being the cause of property price bubbles.
 Most asset classes have derivative markets. Professional investors assume that property derivatives market worked property, and the deleveraged REIT returns are closely linked to underlying market. Real estate invest in real estate debt (in effect deleveraging), use derivative trades for liquidity or use long-short trading to take positions on market views, and need to buy real estate at all. Purchaser gets low cost, diversified returns without alpha. Seller hedges underlying assets or reinvests cashflow. If there are some products that allow them to invest to increase the house price, then the investors can hedge against the increase of the house price and build up my investment. The investors could track the increase of the house prices and reduce the exposure of the house. They can diversify in the portfolio. A derivative market will give you pricing information for the pricing symmetry. The U.S. real estate is strongly distorted by derivatives and arbitrage argued by Schiller.
- The global financial crisis and leverage: worsening the impact of collateral losses and borrowing
 The factors that determine the leverage level are: financial covenants, property market/cycle, income to repayment ratio, sum of deals, maintain credit rating, dividend policy, competitor debt levels, tax benefits, and other factors. They are weighted from the largest proportion to the smallest proportion respectively. Leverage does hurt growth in the sense that it worsens the impact of collateral losses. Figure 1 explores the impact of a lower steady-state leverage ratio, 25% instead of 50% as in the baseline scenario. The figure shows that a reduction in leverage significantly moderates the cycle.
 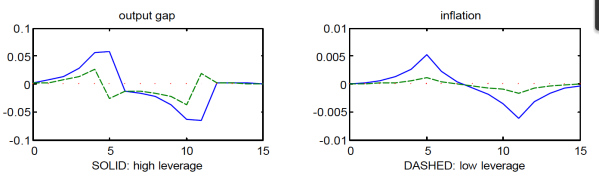
Figure 1. The effects of leverage on responses to an asset-price boom and bust
Notes: Comparison of high steady-state leverage (ratio of net worth to capital of 0.5, as in baseline simulations) and low steady-state leverage (net worth-capital ratio of 0.75). Monetary policy is assumed to target expected inflation aggressively.
 For example, firms or households may use assets they hold as collateral when borrowing, in order to ameliorate information and incentive problems that would otherwise interfere with credit extension. Under such circumstances, a decline in asset values (for example, a fall in home equity values) reduced available collateral, leads to an unplanned increase in leverage on the part of borrowers, and impedes potential borrowers’ access to credit.
 Supportive of the bubble-size hypothesis shows that the greater the gain prior to the shock between 1986 and 1989, the greater the fall in the post-shock period. Leverage is significantly positive, probably suggesting that firms that can secure borrowing are better firms and those with better relationships (Gan, 2007). Lamont and Stein (1999) show that house prices into metro areas with high levels of leverage are more sensitive to income shocks than house prices in metro areas with less leverage.
 At an individual level, Genesove and Mayer (2001) show that leverage has a large impact on seller reservation prices in a downturn, affecting both the probability of sale and the subsequent sales prices. Others have shown that liquidity affects refinancing behavior and mobility. While Case and Shiller (1988) use surveys to show that market conditions affect the reported expectations of recent home buyers, few papers have explored the role of information and psychology on expectations formations and transactions prices.
 Leverage drives up volatility of returns and bad timing issues, and LTV based lending is highly risky with the characteristics of being both pro-cyclical and vulnerable to downturns. Income/earning based constraints are more robust, and NB debt maturity, downside risk and refinancing risk are both crucially important for the leverage performance.
 Non-contractibility imposes limits on borrowing: and debt contracts secured on land are the only financial instruments that creditors can rely on (Miller and Stiglitz, 2010). This puts a strict upper limit on the amount of external finance that can be raised: so the rate of expansion of the small businesses is determined not by their inherent earning power but by their ability to acquire collateral. Even without intermediaries, a credit-constrained market economy-where collateral is used to handle repudiation risk-can exhibit liquidity crises and asset price crashes (Geanakoplos, 2003).
 Highly leveraged borrowers can very easily become insolvent. Giacomini et al. (2015) show highly leveraged REITs produce lower average returns and lower Sharpe ratios over cycle and much greater falls in bear markets. Leverage is producing the worst risk adjusted return. If their net worth were only 5% of assets held as collateral for loans, a correction of asset prices in excess of this would be enough to wipe out their net worth-even before fire-sales begin. As Koo (2011) describes it, the collapse of an economy-wide asset bubble could be the economic equivalent of the collapse of a supernova-with the ‘black hole’ of insolvency threatening to swallow whole sectors of an over-leveraged economy. The consequences of technical insolvency were seen as so severe, indeed, that a preemptive strategy of concealing the true balance sheet position was apparently in Japan (Koo, 2011). As lending is liberalized and leveraged increased at the same time that prices are inflated (as the result, in part, of bank’s capital reserves’ growth), moral hazard further undermines lenders’ incentives to price loans efficiently and exacerbate these underlying forces for the provision of excessive credit (Herring and Wachter 1999). The impact of leverage (recall irrelevance proposition-but also costs of financial distress and no tax shield for REITs) is dependent upon market perception of management ability, and CAPM (or factor models) can be used to assess the risk premium. The study covers the short-term and long-term dynamics of the assets, correcting for leverage in the direct real estate indices. Results suggest that long-run REIT market performance is more closely related to the direct real estate market than to general stocks, similar response to shocks in fundamentals.
- Asset market features that hamper arbitrage processes
 The inefficiencies in underlying asset market include high round trip transaction costs, illiquidity and time to trade, real management costs, and heterogeneity and “alpha” (the retail portfolio preference). An obvious reaction to market inefficiency is arbitrage. Arbitrage signifies taking advantage of pricing inefficiencies without any exposure to risk, and creates abnormal profits (no free lunch). When arbitrage speculators enter the market, adding liquidity, it is reasonably assumed that these are mostly short-term investors, as arbitrage investors by their nature tend to buy and sell more rapidly than most other investors. Theoretical analyses suggest expected margin should be zero or close to zero for the underlying asset markets and rational margins (arbitrage portfolio). However, in practice consumers and FI do not arbitrage in the housing market (Farlow, 2004).
 Arbitrage in the real estate market is risky for several reasons. First, a player has to be sure that there are enough players in the market that are also arbitraging: an insufficient proportion of arbitrageurs might cause the inefficiency to persist. The execution time is more painful for the buyers than the sellers. In any one market, there are more buyers than sellers. Second, another risk is the impossibility to obtain general agreement on the deviation from a certain fundamental value. Third, houses are heterogeneous assets that rarely have close substitutes and hence are traded in segmented markets. In addition, no central exchange exists so information is far from perfect. Furthermore, the relatively high transaction costs and the absence of short-selling opportunities in housing markets make arbitrage even riskier (Hong and Stein, 2003; Farlow, 2004). Money illusion in real estate implies the failure of consumers to evaluate alternatives during a period of inflation due to a difference between nominal and real values. It plays an important role in real estate because it generally deals with long-term projects and frictions, like short-sale constraints, which makes it difficult to arbitrage mispricing away.
 There are several ways of the improvement of the market: the lack of liquidity, the pricing issue, the inability to arbitrage, the trench to pension funds and so on. Hence, it is better to exploit momentum in this risky market than to try to fight against it in time of excess. When the real estate portfolios lack momentum effects, they would rather have big margins. Professional investors should get rid of their retail portfolios while they are actually selling and trading.
- Research Methodology
 An iconic model with high leverage and overvalued collateral assets is used to illustrate the amplification mechanism driving asset prices to ‘overshoot’ equilibrium when asset bubble bursts-threatening widespread insolvency and what Richard Koo calls a ‘balance sheet recession’ (Miller & Stiglitz, 2010). For the purpose at hand-to study the dangers posed by ‘excessive leverage’ and how capital restructuring may be needed to avert economic collapse when an asset bubble bursts-we make use of a stripped-down framework of heterogeneous agents with explicit credit constraints but no intermediaries (Miller & Stiglitz, 2010). Before considering what happens when an asset bubble collapses globally, consider how things evolve with perfect foresight, starting with small businesses that borrow up to the hilt and happily postpone consumption of traded goods to some later date. Their flow of funds accounts show land holdings, denoted evolving as:
or, in symbols, where is the amount of one-period borrowing to be repaid as (R is one plus the one-period interest rate), is price of land, and measures the productivity of land in this sector.
 The credit constraint, assumed to bind at all times, is that borrowing gross of interest matches the expected value of land, i.e.
 As the degree of leverage is keyed to expectations of future prices, there will be more lending when capital gains are in prospect-as was true for sub-prime lending according to Gorton (2008). This will be crucial when an asset bubble is considered. But with perfect foresight of future land values, substitution into (1) yields an ‘accumulation’ equation for small businesses who use all their net worth to make down payments on land, namely:
where the expression in parentheses on the left is the down-payment required to purchase a unit of land and the term on the right measures both the productivity of those resources in this sector and SB net worth.
 By adding an asset bubble to a canonical model of highly leveraged businesses, Miller and Stigliz (2010) have highlighted the vicious downward spiral that may develop when asset prices begin to fall and have outlined a variety of measures that may be used to check this-with the government stepping in because of the externalities and moral hazard involved. The authorities in both the US and UK have of course undertaken extraordinary financial interventions, amounting in total to around three quarters of GDP (Miller and Stigliz, 2010).
- The arbitrage scenario of the asset market bubbles
 Suppose in addition to the fundamentals (net rents), we define a periodic “bubble component” b; then any of the following form will also satisfy arbitrage conditions and be “rational”:
, with .
Thus, if at time t an asset is overvalued by an amount , a rational investor will still purchase such an asset, if the degree of overvaluation is expected to grow by a rate equal to or greater than the appropriate discount rate. In turn, this implies that a necessary condition for housing bubbles to form is serial correlation in price changes. However, to anticipate results below, in our model housing bubbles will be self-limiting because new supply is being built.
- Panel unit roots and co-integration tests
 As a tentative attempt to partly overcome this problem, I exploit the rather large cross-section dimension of my analysis to perform unit root and co-integration tests. Asa first step I perform standard augmented Dickey-Fuller (ADF) unit root tests (Dickey and Fuller, 1981) to test for the order of integration of the time series under investigation. The ADF test regression is of the form:
 Allowing for a maximum lag order of four, the lag order was determined by sequential t-tests eliminating all lags up to the first significant at the 5% level. The test regression for the level of each variable contained a constant and a trend; the test regression for the first difference contained only a constant. The ADF test statistic is the t-statistic of . If is significantly smaller than zero, the null hypothesis of a unit root can be rejected. I also report a panel ADF test proposed by lm et al. (2003). They show that the standardized average of the N individual ADF test statistics
   (6)
has a standard normal distribution, where is the average of the individual ADF test statistics and and are respectively the mean and the variance of the distribution of the ADF test statistic. The appropriate mean and variance adjustment values are tabulated in Im et al. (2003). The test is one sided. The 1%, 5%, and 10% critical values are -1.96, -1.64, and -1.28. Large negative values therefore imply a rejection of the null of a unit root.
 On the whole, the results suggest that the natural logs of real bank lending, real property prices and real GDP are integrated of order one. This conclusion is suggested both by the individual country level tests as well as by the panel tests. The short-term interest rate appears to be a borderline case. The null of non-stationarity is rejected at least at the 10% level in seven countries out of 20 countries. The panel unit root test strongly suggests that the real interest rate is a stationary process.
 Given the results of the unit root tests we test in the following for the presence of a long-run relationship between real bank lending, leverage and real property prices. The level of the real interest rate is not allowed to enter the long-run relationship. The Johansen approach is based on maximum likelihood estimation of a cointegration VAR model, which can be formulated in vector error correction form:
(7)
where x is a vector of endogenous variables comprising the log of real bank lending, leverage and real property prices. is a vector of constants and is a vector of white noise error terms. Since I want to allow for deterministic time trends in the levels of data I leave the constant unrestricted. The rank of the matrix indicates the number of long-run relationships between the endogenous variables in the system. The cointegrating rank hypothesis for the Johansen trace test is specified as against the alternative .
 The lag order of the VECMs was determined based on sequential likelihood-ratio tests, eliminating all lags up to the first lag significant at the 5% level. The 1%, 5% and 10% critical values are respectively 35.65, 29.68, and 26.79 for , 20.04, 15.41, and 13.33 for for and 6.65, 3.76 and 2.69 for I also report the result of a panel cointegration trace test proposed by Larsson et al. (2001).
- Policy Suggestions
- Flexible inflation targeting
 Under the accommodating policy, the bubble stimulates aggregate demand, leading the economy to “overheat”. In contrast to the accommodative policy, the more aggressive “inflation targeting” policy greatly moderates the effects of the bubble. As with the case of bubble shocks, the results indicate that the policy that responds aggressively to inflation and does not target stock prices works best. Under inflation targeting monetary policy is committed to achieving a specific level of inflation in the long run, and long-run price stability is designed the “overriding” or “primary” long-run goal of policy. Inflation targeting is generally characterized by substantial openness and transparency on the part of monetary policymakers, including for example the issuance of regular reports on the inflation situation and open public discussion of policy options and plans.
- Regulatory initiatives to control “excessive” lending in real estate markets
 Banks have overextended their lending during periods of high asset inflation, exposing themselves to greater portfolio risks during periods of declining asset value. Bank lending to related parties, as bank owners sought to capture the gains from their speculation, has aggravated the adverse impact of speculative lending. In response, regulatory authorities have increasingly restricted lending for real estate and to related parties-as well as lending concentrated on a few borrowers. Restrictions on related lending have been difficult to implement, however, because disclosure rules are generally poor, and in Indonesia, Japan, and Thailand, banks and firms have interlinked ownership, and companies are closely held (Stiglitz and Uy, 1996). Although governments established priorities for lending-and discouraged lending for real estate and consumer goods-they still employed commercial standards. Prudential regulations, particularly capital adequacy requirements and controls on real estate lending, are essential and replicable. The adaptability of government policies-the ability to abandon policies when they fail and to change policies with changing circumstances-is clearly a lesson of general applicability, although it is hard to design institutions that capture that lesson.
 A monetary policy regime focuses on asset prices rather than on macroeconomic fundamentals may well be actively destabilizing. The problem is that the central bank is targeting the wrong indicator. As an alternative metric for evaluating policy responses to bubbles, Bernanke and Gertler (2000) computed the unconditional variances of output and inflation under the four different policy scenarios (accommodative versus non-accommodative on inflation, responding to stock prices versus not responding).
- Conclusion
 Over the last few years, the coincidence of cycles in credit and property markets has been widely documented and discussed in the economic policy oriented literature, In this paper, I analyse the causes of this coincidence. From a theoretical point of view, the relationship between bank lending and property prices is multifaceted. Property prices may affect credit via various wealth effects, while credit may affect property prices via various liquidity effects. Previous empirical studies were not able to disentangle the direction of causality, since the focus was usually on one of these effects bot not on both.
 Long-run causality appears to go from property prices to bank lending, rather than conversely. This finding suggests that property price cycles, reflecting changing beliefs about future economic prospects, drive credit cycles, rather than excessive bank lending, in the wake of financial liberalization or overly loose monetary policy, being the cause of property price bubbles. However, there is also evidence of short-run causality going in both directions, implying that a mutually reinforcing element in past boom-bust cycles in credit and property markets cannot be ruled out.
- References
Bernanke, B. and Gertler, M., 2000. Monetary policy and asset price volatility (No. w7559).
 National bureau of economic research.
Case, K.E. and Shiller, R.J., 1988. The behavior of home buyers in boom and post-boom
 markets.
Farlow, A., 2004. The UK housing market: bubbles and buyers. Oriel College.
Gan, J., 2007. The real effects of asset market bubbles: Loan-and firm-level evidence of a
 lending channel. Review of Financial Studies, 20(6), pp.1941-1973.
Geanakoplos, J., 2001. Liquidity, default and crashes: Endogenous contracts in general
 equilibrium.
Genesove, D. and Mayer, C., 2001. Loss aversion and seller behavior: Evidence from the
 housing market. The Quarterly Journal of Economics, 116(4), pp.1233-1260.
Gerlach, S. and Peng, W., 2005. Bank lending and property prices in Hong Kong. Journal of
 Banking & Finance, 29(2), pp.461-481.
Giacomini, E., Ling, D.C. and Naranjo, A., 2015. Leverage and returns: A cross-country
 analysis of public real estate markets. The Journal of Real Estate Finance and
 Economics, 51(2), pp.125-159.
Gorton, G.B., 2008. The panic of 2007 (No. w14358). National Bureau of Economic
 Research.
Herring, R.J. and Wachter, S.M., 1999. Real estate booms and banking busts: an
 international perspective.
Hofmann, B., 2003. Bank lending and property prices: Some international evidence.
Hong, H. and Stein, J.C., 2003. Differences of opinion, short-sales constraints, and
 market crashes. Review of financial studies, 16(2), pp.487-525.
Koo, R.C., 2011. The Holy Grail of Macroeconomics: Lessons from Japan? Great
 Recession. John Wiley & Sons.
Lamont, O. and Stein, J.C., 1997. Leverage and house-price dynamics in US cities (No. w5961).
 National bureau of economic research.
Lang, L., Ofek, E. and Stulz, R., 1996. Leverage, investment, and firm growth. Journal of
 financial Economics, 40(1), pp.3-29.
Larsson, R., Lyhagen, J. and Löthgren, M., 2001. Likelihoodâ€based cointegration tests in
 heterogeneous panels. The Econometrics Journal, 4(1), pp.109-142.
Im, K.S., Pesaran, M.H. and Shin, Y., 2003. Testing for unit roots in heterogeneous
 panels. Journal of econometrics, 115(1), pp.53-74.
Miller, M. and Stiglitz, J., 2010. Leverage and asset bubbles: averting Armageddon with
 Chapter 11?. The Economic Journal, 120(544), pp.500-518.
Reinhart, C.M. and Rogoff, K.S., 2013. Banking crises: an equal opportunity menace.
 Journal of Banking & Finance, 37(11), pp.4557-4573.
Salzman, D.A. and Zwinkels, R.C., 2013. Behavioural Real Estate.
Stiglitz, J.E. and Uy, M., 1996. Financial markets, public policy, and the East Asian
 miracle. World Bank Research Observer, 11, pp.249-276.