Complaints and Risk Management
1.1
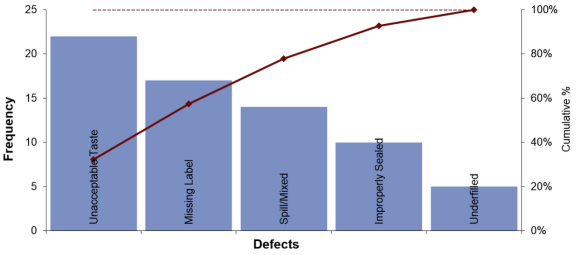
1.2
|
Defects |
Line1 |
Line2 |
|
Unacceptable taste |
14 |
8 |
|
Missing Label |
11 |
6 |
|
Under filled |
3 |
2 |
|
Spill/ mixed |
6 |
8 |
|
Improperly sealed |
1 |
9 |
|
Total |
35 |
33 |
After analysing and evaluating all the defects we came to the conclusion that the most numbered defect combining Line 1&2 is Unacceptable taste. Maddy needs to make the following recommendations to her manager:-
- The recipe needs to be improved
- The machines processing the meat should be maintained properly
- People who are working should be paying careful attention to the recipe and adhere to the guidelines to preparing the meat
- Raw materials used should be checked properly before using.
1.3
|
S.NO |
Time |
No.of defects |
|
1 |
08:30 |
3 |
|
2 |
09:00 |
3 |
|
3 |
10:30 |
8 |
Unacceptable taste occurring in Line 1
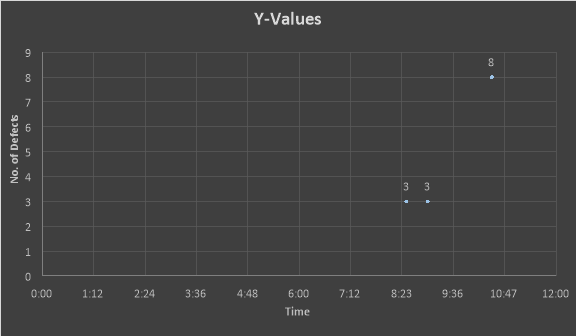
As per the calculation and the graph we analyse that the most number of defects for unacceptable taste occurred at the time of 10:30am. So, to overcome these defects manager needs to check the people who are working in that shift in Line 1 to check what is going wrong and what are the procedures they are following and if it’s wrong then train them to follow the right procedures and guidelines and make sure all the machinery is working.
2.1
|
Serial No. |
Types of Complaints |
Includes |
Frequency |
Total |
|
1 |
Cleanliness/layout |
This category includes any complaints regarding the cleanliness of the store |
ï‰ï‰ï‰ |
15 |
|
2 |
Out of Stock |
This category includes complaints about out of stock |
ï‰ï‰ï‰ï‰ï‰ï‰ ï‰ï‰ï‰ï‰ï‰ï‰ ï |
62 |
|
3 |
Staff Issues |
Staff being rude, slow or unhelpful |
ï‰ï |
7 |
|
4 |
Stale Products |
Products which are not fresh or expired |
ï‰ï‰ |
10 |
|
5 |
Poor store Maintenance/ Layout |
Customers not able to find the products or anything broken in the store |
ï‰ï‰ |
10 |
|
6 |
Overcharge |
Customers being overcharged for the products |
ï‰ï‰ï‰ |
15 |
|
7 |
Wrong price/Undercharge |
Customers being wrongly charged or undercharged |
ï‰ï‰ï |
12 |
|
8 |
Defective Product |
Products which are not smelling or looking good or the damaged packing or the goods |
ï‰ï‰ï‰ï |
17 |
|
9 |
Fluctuating store temperature |
Customers complaining the temperature to be either too hot or too cold |
ï‰ï‰ |
10 |
|
10 |
Long queues at the checkout |
Customers complaining about the time getting wasted due to long waiting time at the check outs |
ï‰ï‰ï‚ |
13 |
|
11 |
Others |
Anything that in the store people don’t find good like decorations, music or the lighting |
ï‰ï‰ïÂÂï |
14 |
2.2: – Bar chart: –
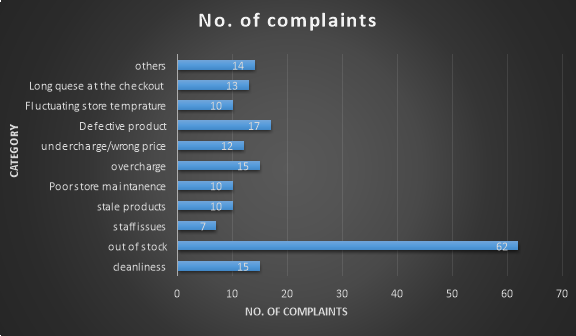
I chose the bar chart as I thought it would be the most appropriate tool in relation to this case because with this quality tool I can clearly see what kind of complaints are the most occurring ones and making sure that the company can prioritise its efforts in solving the most important and occurring complaints and go to the least occurring one but this doesn’t mean that the least occurring complaints will not be paid attention to but with the help of this quality tool we can prioritise to solve the root cause of the problem.
2.3 Cause and Effect Diagram:
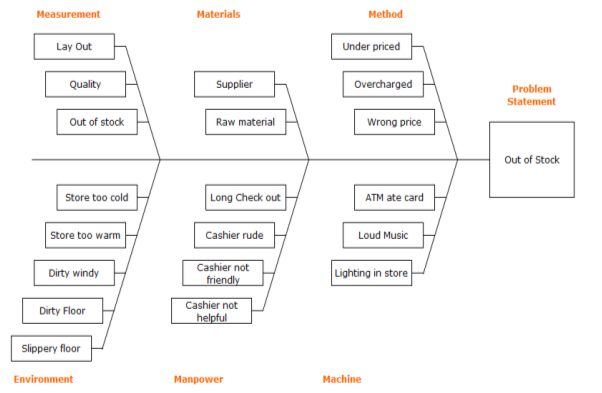
Three Main Problems:-
Out of Stock
The problem with this issue head on the chart is the main concern. Even the non-availability of products in store dissatisfies the customers the most and also that encourages the customers to go the other competitors which results in loss of business.
Defective Stock
Defective stock is another issue which increases the customer’s complaint and it paints a negative picture of the business in the eyes of its customers.
Wrong Pricing (undercharged/ overcharged)
The other cause of dissatisfied customers is wrong pricing be it undercharging or overcharging. In either case the business is at risk because if its overcharge the customers there are going to be a lot of customer complaints and if it undercharges the customers then the business is losing its profits.
2.4: -Run Chart:
 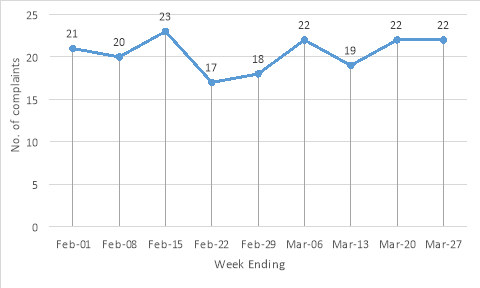
As we can see that the mistakes were going ups and downs from Feb 01 to Mar 13 and after they had the training on Mar 15 we can see that there wasn’t any significant impact on the complaints received from the customers. So it is really important to the manager to check what the employees have been trained of and makes sure to let them know what needs to be done to lower the number of complaints
2.5
There are many areas that needs improvement to make sure that the complaints company is getting can be lower to the minimum levels. So following are the recommendations I would like to Vice Ganda after all the investigation: –
- Stock Availability:- To make sure that the customers are walking happy out of the store and having a positive impact of the store it is very important to have all the stock available which is needed by the customers
- Staff Availability: – Many customers complained about the long queues and staff being unhelpful, rude or irritated. So it is very important that all the staffs are trained to do their job skillfully and make sure that they are not overburdened by the work which makes them frustrated with the customers and make sure to open more checkouts to ensure that the customers won’t have to wait too long to pay.
- Defective or Expired Product: – There were a lot of complaints about the products being defective or expired or stale which is a very negative sign for any business. So all the staff needs to make sure to check the expiry of the products and put all the products which are either defective, stale or expired out of the sight of the customers.
- Pricing Issues: – Many customers have complained about the wrong pricing where they have been charged of the wrong price be it overcharging and undercharging and which in both cases is very negative for the company because if the company overcharges its losing its customers and if its undercharging its losing the profit so all the staff needs to be well trained of the system to make sure that all the customers are charged the exact price.
Answer 3:-
Calculating p. “p” means fraction defective.
|
Sample |
Sample Size(n) |
# of Errors(np) |
Fraction (p) |
|
1 |
350 |
7 |
0.020 |
|
2 |
350 |
6 |
0.017 |
|
3 |
350 |
5 |
0.014 |
|
4 |
350 |
0 |
0 |
|
5 |
350 |
0 |
0 |
|
6 |
350 |
5 |
0.014 |
|
7 |
350 |
6 |
0.017 |
|
8 |
350 |
3 |
0.009 |
|
9 |
350 |
4 |
0.011 |
|
10 |
350 |
2 |
0.006 |
|
11 |
350 |
1 |
0.003 |
|
12 |
350 |
8 |
0.023 |
|
13 |
350 |
9 |
0.026 |
|
14 |
350 |
10 |
0.029 |
|
15 |
350 |
11 |
0.031 |
|
16 |
350 |
6 |
0.017 |
|
17 |
350 |
5 |
0.014 |
|
18 |
350 |
4 |
0.011 |
|
19 |
350 |
2 |
0.006 |
|
20 |
350 |
0 |
0 |
a.2:
Calculating Sp, Average of p.
Sp= ∑ p / k                       [∑ p = all p values; k= Number of sample]
= 0.269 / 20
= 0.0134
= 1.34%
a.3
Calculating UCL:
UCLp = (     =
   = 
UCLp = .0134+ .0184
UCLp = .0318 = 3.18%
a.4
Calculating LCLp:
LCLp =    =
  = 
LCLp = .0134 – .0184
LCLp = – .005 ≈ 0


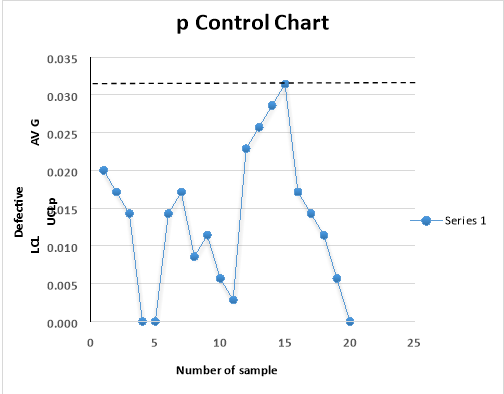
C. After we have done all the calculation and plotted all the samples, the whole process in under control and the range of the samples is not topping the UCL. UCL is the limit that decides that the sample size we are using should not be above it and tells us whether it is defective and the whole range of samples we have calculated and plotted we did the whole analysis based on that and it helps us to know what are the defects in the sample and if it requires the improvement. This chart is really helpful and efficient to check the performance of the quality tests because the samples of the product are tested against the set parameters to check the quality of it. In this chart we can see that 15 is the highest number which shows that the sample is defective and it needs to be resolved.
Part B: Risk Management
1.1
A Risk management helps to identify, assess and prioritize the risks in advance and taking precautionary steps to minimise, monitor and control the possibility of the unfortunate events or circumstances. Some risk taking is unavoidable if an association wants to accomplish its goals. But before taking any risks a good organisation will evaluate the whole situation and will take the appropriate measures to make sure that the risk they are taking would not have negative implications on the survival and growth of the business. Every Risk management process usually follows the basic 5 steps which are as follows:-
- Risk Identification: – The very first step of the Risk management process is to identify the risks that can affect you, your team and the project. You need to make sure that you take into consideration every little possibility of risk doesn’t matter how small is it.
- Analyze the risk: –After you have identified the risks you need to make sure that you analyze the occurrence and repercussions of each risk. You need to understand how each risk can affect the project and the organization and in which manner.
- Evaluate the risk: – After analyzing the risks, we need to evaluate the risk and rank in the categories which could be anything like small or big risks, management or financial even how likely they can occur and then consider which risk is worth taking and will not harm the organization
- Treat the risk: – After evaluating all the risks, we need to take appropriate measures to treat the risk and take necessary steps by which we can lower the chances of its negative implications because doesn’t matter what the risk is we can’t eliminate it fully but we can take measures to lower its impact on the organization.
- Monitor and Review the risk: – After taking all the precautions and starting with project you monitor and review all the measures that has been taken to lower the impact of the negative implications of the risks.
Effective risk management is likely to improve performance against objectives by contributing to:
- It helps in efficient utilization of assets
- Waste Reduction
- Decreased extortion
- Better administration by reducing unnecessary operations
- It emphasizes on loss prevention
- Helps to identify risks outside the company
- Enhanced development
- Helps improving the possibility of progress activities needs to be accomplished
- Helps to develop the policies that will help to achieve organizational goals
- It helps reducing operational losses
- Helps to foresee the unfortunate circumstances and helps to prepare for it.
1.2
We need to make sure that shareholder esteem from danger administration by connecting danger to business execution. It includes the danger which includes the decisions to make about our procedures. The company need to invest in the continuous improvement because it’s not just onetime thing. It helps to build a methodology to know all the risks and how to overcome it. It creates a lot of responsibility to the people who are handling to the procedures and making sure they are answerable to their actions. It creates an agreeability in the organisation to make sure that risks are determined at the very starting stage. Measurably, high performing danger associations are more prone to have an Enterprise Risk Management program.
2.1
SIS had a lot of problems when the company decided to go into a whole new market in terms of supply network where they tried to cater toy industry which they haven’t done before and it was a completely new market for them even the operation manager and marketing manager also said that the risk was too high because the market they were going to serve was quite new and the risk was high because they haven’t done something so big in their company’s history and whereas the Alden toys are concerned under planning of the decision to invest heavily with SIS was a really big decision to only invest in a single source or partnerships supply networks management initiative.
In terms of capacity, As well as allocating the dedicated capacity to a customer specific, the Alden toys production shifted from low volumes and multiple customers to high volume and single customer. It wasn’t a good decision to make such a drastic shift because they needed to make more profits but instead they end making loses due to this immature decision.
Process Technology, It was an unnatural product similarities that has led to an inappropriate production process being used for the production because of which process technology that was used has been accused of causing health problems. Because of which the company lost its reputation in the market and got a negative picture in its consumer’s eyes.
Development and organisation: An assumed similarity between existing and new product has led to the insufficient exploration of specific design brief which is always needed to be explored before starting to produce a new product. As a result of design errors, the quality control systems introduced proved to be inappropriate and at fault
2.2
Operational risk is the risk an organization or firm adopts when it tries to work inside of a preferred field or industry. Operational risk is the risk that is not necessary in financial, precise or vast danger. It is the danger which helps in deciding financing and operational hazards, and tries to tell the danger that might come in the organisation in terms of finances operations or human resources. Operational risk can also be considered as human danger; it is the danger which prevails in businesses due to human errors. Operational danger varies from different industries to different fields, and is an important thought to take into consideration when you need to make your investment decisions. In case of SIS, the company has high human interaction which is likely to have higher operational risk. It can be classified into 3 categories:
Human: Human errors were the most important area that SIS needed to cover because due to bad design and production line the toys got poisoned and made such a big issue about it which in turn made a really bad impression of the company.
Organizational: The organization was going on a right path but they made the wrong decision to enter into a market which they had very little knowledge about and that toy market which they wanted to enter they had very little knowledge about it.
Technological: These are the risks that prevails due to the technology that a company uses. In the case of SIS the technology used by them has so many drawbacks due to which the whole company suffered. They tried to use the technology which they had very little knowledge about.
References:-
- INTRODUCTION. (n.d.). Retrieved from
- Risk Management. (n.d.). Retrieved from
- 6 benefits of a risk management assessment – Associated Benefits and Risk Consulting. (n.d.). Retrieved from
- What are the 5 Risk Management Process Steps? (n.d.). Retrieved from
- Definition of Risks and Risk Management Methods for Mizuho_Financial_Group (MFG). (n.d.). Retrieved from