Enterprise Project Management
Test 1
CIDM 6390 Enterprise Project Management Professor:
Jeremy Bellah, Ph.D., PMP
Bahareh Naderi
995551
1.Describe the metrics and characteristics of projects using a specific example?
When you focus on creating something new and unique temporary with definitive start dates and end dates. it means that you are working on project .you can say your project is completed when you reach the goals and objectives that define before by stakeholders. Sometimes you cannot achieve to the goals or result of the projects is no longer useful and the project is canceled. Let me bring one example and explain all characteristics of the project .For example you are working in a clothing factory, you receive an order from school for design special uniform for students now you will ask yourself is it project?                                        The first question is about uniqueness? yes ,it is new because you design something different .                                         what about limit time? Yes, you have a short time to hand in your order exactly before the school starts and when you ship your order, the project will be completed and you will achieve the goal when the manager and students become happy by seeing clothes and always remember A successful project is one that meets the expectations of your stakeholders.
PROJECT METRIC
What is metric? Metric is a standard measurement .It will help you to check your project base on efficiently on performance and progress ,productivity,….
By using metric you can improve the ability of making decision in your organization and you can understand your situation and asking yourself which way is working within the organization and apply the guide and go forward to right direction.
Project management metrics can help Project managers to:
- Understand your situation in terms of schedule, cost and profitability.
- Be aware of risks
- Overcome problems before becoming serious
- Keep an eye on project profitability
- Estimate the performance of your team
- Evaluate your work product base on quality
Complexity and nature of each project can create different project management metric. We have five group of metric performance .These five attitude can cover all aspect of project in execution process.
1.cost variance
The purpose of this metric is to measure project’s progress and performance against signed baselines. By using this method, in a certain point of time, we can conclude the expected cost and duration of the project.
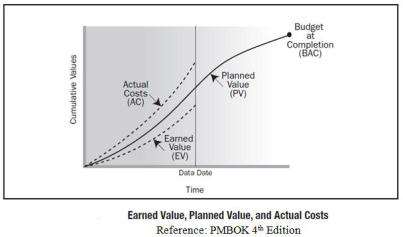
Planned Value (PV): is about how much you planned to spend for the planned work.
PV at any period = (Planned % Complete) X (BAC)
Earned Value (EV): how much you planned to spend for the work you actually did.
Actual cost (AC): Actual cost is the exact cost that happened during the project to complete or in WBS process and the cost was recorded. .
Schedule Variance (SV):by this method we will measure our project schedule performance. The difference of Earned value and the planned value SV = Earned value- Planned value
- If you get Positive answer. It means that you are ahead of your schedule.
- If you get Negative answer. It means that you are behind your schedule.
Cost Variance (CV): is the measure of cost performance on the project.
earned value (EV) deduct from actual costs (AC).if you get negative CV .It means is too hard to recover to the project.
CV = Earned value – Actual cost
2. Effective use of resources
To measure how we use our resources base on productivity
Utilization% = Total Effort spent by resource/Total Budgeted Effort for the resource
3. Change requests to Scope of work.
For the whole project we use the sign scope by customer , so if any change happen to the sign scope should happen in controlled way.
4.Quality of project and meet customer needs
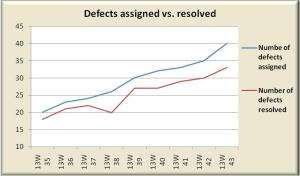
As you can see quality is a very import factor and quality control will happen during the life cycle if we detect defects in latest stage it will affect more .we have several defects such as Defect density = Total number of defects found/ Measure of size and defects age(Number of days since the defect is open and not fixed) and Defect resolution rate = Total number of defects resolved/ Total effort spent and Number of defects reported by customer.
5: Gross Margin
Shortest way to understand if your business in on correct track or not and be aware of situation to put in place margin improvement initiatives.
2.Explain the differences between project, program, and portfolio management?
Let me explain the differences of them by graph and example


Project                             program                                             portfolio
Project will create product or service for example developing software and process will create result Imagine we want to develop a software for managing our document we will consider this work as a project then assume that we want to improve our document’s management in other words access in a faster, better way to documents this work is program because we focus on result not product. What about portfolio when we improved our access in document’s management this result will bring benefit such as decreasing in current liability or increase company’s credit we will consider this benefit as portfolio.
In summary:Â Â Â Â Â Â Â Â Â Â Â Â Â Â Â Â Â Â Â Â Â Â Â Â Â Â Â Â Â Â Â Â Â Â Â Â Â Â Â Â Â Â Â Â Â Â Â Â Â Â Â Â Â Â Â Â Â Â Â Â Â Â Â Â Â Â Â Â Â Â Â Â Â Â Â Â Â Â Â Â Â Â Â Â Â Â Â Â Â Â Â Â Â Â Â Â Â Â Â Â Â Â Â Â Â Â Â Â Â Â Â Â Â Â Â Â Â Â Â Â Â Â Â Â Â Â Â Â Â Â Â Â Â Â Â Â Â Â Â Â Â Â Â Â Â Â Â Â Â Â Â Â Â Â Â Â Â Â Â Â Â Â Â Â Â Â Â Â Â Â Â Â Â Â Â Â Â Â Â Â Â Â Â Â Â Â programs are group of related projects, we will apply similar techniques. Sometimes programs involve aspects of ongoing operations.Portfoliosare collections of programs, sub portfolios, operations, and projects that support strategic business goals or objectives Programs and projects within a portfolio are not necessarily related to one another in a direct way.
3. Describe how processes relate to process groups and knowledge areas in the PMBOK Guide. Provide a specific example of a process that we covered in one of the first 6 chapters of the book?
There are five Process Groups:
- Initiating                                             Define goals/specifications
- Planning                                                Plan the project
- Executing                                          Schedule the project
- Monitoring & Controlling               Manage the project
- Closing                                                  Finish the project
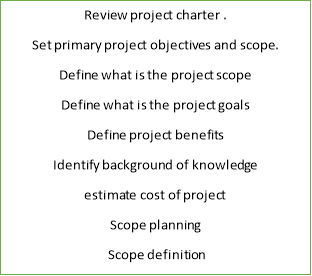


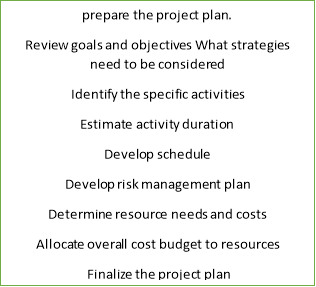


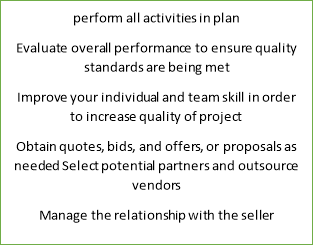
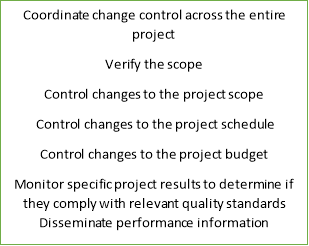


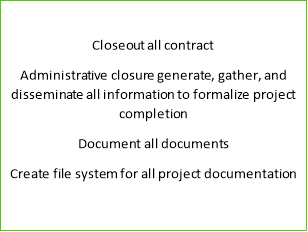

We have ten knowledge areas 1. integration 2.Scope 3.time 4.cost 5.quality 6.HR 7. Communications 8 risk 9 .Procurement 10.stakeholders
Ten knowledge areas: Knowledge Areas are used on most projects most of the time. It is up to the project management team to define the appropriate depth of implementation for each project.
We have 44 process the relationship between five process group and ten knowledge .summarize in following  table 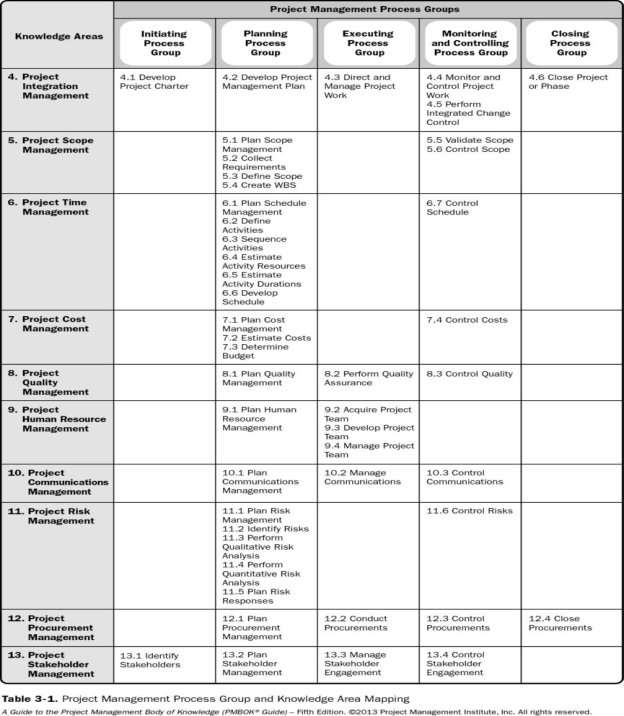
Now let me give you an example to clarify the connection between project management and knowledge area .
For example: imagine you are a project manager working on project team for a software instruction project. The six factors that you have to calculate in project management software are as fallows :
1.Task duration 2.start time 3.finish time 4.precedence relationship 5.resources 6.unit allocation
For example: we go through following process to finish the project
1.In the first step of the project ,which includes approving and developing the project charter.
2.In the second step make the project management plan which help you to cover several project activity
3.Third step accomplish the project and it is the step that actual work and time happened .
4. This step is controlling and monitoring the project
5.In the last step , we finish the project.
Knowledge areas are separated to keep the same type of accomplishment set in one group.
For example you are developing and planning process of the plan for your project. In this process ,to compute the budget you will use two processes: calculate costs and determine budget.
4. Describe the purpose and contents of a project charter?
Project charter can be very powerful tool because it will give you proper visibility , because it will inform you exactly the roles and responsibilities and put the project in the way of the strategic goals and objectives of the organization. The Project Charter will sign by project sponsor so that the Project Manager is given clear authority by the one sponsor..
According to the (PMBOK), a Project Charter results from one of the following needs, or business requirements:
1)Demand of market
2)Need of business
3)Request from customer
4)Advance in technology
5)Social need
6)A legal requirement
Let me bring one example and explain the contents of project charter imagine we want to renovate a hotel what will be in project charter first The purpose for the project through a description of the business needs that the project is going fulfill then we will explain about background and then about high level project approach in this case the project will be divide to two phase first renovation and construction (about 9month) and then re-opening (about 12 month) and then we will clarify business goal for example in this case we have two goals restore the property to profitability and Disassociate the hotel from its previously tarnished image and then what is project goals for example Complete renovation of the hotel onetime .
A project charter can be as short as 1 page, and as long as 200 pages. Writing too much detail in early
stages is difficult, as too much detail may not even be available.
5.Describe three classic business level strategies. What is the relationship between business level strategy and project selection?
Porter (1980) claimed that there are three generic strategies: 1)cost leadership2)differentiation and focus.
Cost leadership:
It inform us organization fallowing a cost leadership strategy in order to access competitive advantage and enhance their share in a market by using low cost producers.
Differentiation:
Organizations fallowing differentiation method in order to satisfies the desires of their customers This differentiation let the organization to charge more.
Best-cost: many researchers believe that a combination of strategies could be the best approach. As a result you can create a sustainable competitive advantage in your organizations and it can effect on your efficiently ,when you combine cost leadership and differentiation, when they provide low-cost products and address customer values .
Multiple competing projects, limited skilled resources, dispersed virtual teams, time to market pressures, and limited capital serve as forces for the emergence of project portfolio management that provides the infrastructure for managing multiple projects and linking business strategy with project selection. Many business man belief that connecting project management with business strategy can significantly enhance the achievement of organizational goals, strategies, and performance. We have mathematic model that can help us to choose better project for investment.
Cost-Benefit Analysis
Comparing the cost of production or services with the benefit
Scoring Models
According your priority you will allocate weight to the criteria then you will decide which one is more suitable for you.
 Cash Flow Analysis Techniques
1.1Payback Period
The length of time will take you recoup your initial investment.
1.2 Discounted Cash Flows
The amount of money you invest now in future what will be your value of your money FV = PV(1 + I)n
1.3 Net Present Value
value of future monies received into today’s dollars
1.4 Internal Rate of Return
projects with higher IRR values are generally considered better than projects with low IRR values.
6.Describe the purpose and contents of a project management plan?
The purpose of project management is to tell you how you manage well execution and monitoring and controlling and closing process in your project and will describe how documents the processes you apply during project .
The first process you have to do in planning process group is project management plan ,actually this process base on knowledge area focus mostly on defining and preparing ,coordinating , and connect all the various subsidiary project plan into overall project plan.as we know for creating document the plan we need to collect input .Project charter, output from other process ,Enterprise environment factors and organization process asset are input of project management plan.
From chapter one we know the meaning of tailoring in project management we use tailoring to determine which processes to apply to best manage the project.
Project charter:as we know the charter will tell you about goals of project and the requirements need to get satisfaction from stakeholder. Charter is an input for project management plan why? Because we use the information in charter such as project objective , milestone schedule, requirements, summery of budget for determining which project management processes to use .
Output from others processes :project management processes include all individual processes that create the process group.
Enterprise Environmental factors: you have to consider some element when you choose processes to perform
project .standard ,company culture and organization structure ,personal administration are elements.
Organization process asset: some critical elements you should pay attention during choosing processes are plan template, change control procedures, performance measurement criteria, historical information, standards, procedures also you should consider about change control processes I mean your organization has existing change control processes in place ,about templates or financial control .You can use historical data and organization past project in order to decide which process is more suitable for the project .
Documenting the project management plan for each processes we do we need output .output usually present in a shape of report or document .in this case you end up with document the project management plan explain about integration, coordinated and subsidiary plans for the processes you apply for the project. According to PMBOK the subsidiary are:
1)scope management plan2)Requirements management plan 3)schedule management plan 4)cost management plan 4)quality management plan 5)communication managements plan 6)risk management plan 7)procurement management plan 8)processes improvement plan 9)human resource plan 10)Stakeholder management plan.
Actually it not easy to finalize some of these subsidiary plans without thinking or doing processes they are associated with first we should remember updates should occur to the project management plans as subsidiary plans are created or changed.
7.Describe the purpose and contents of a work breakdown structure?
The purpose of WBS is decompose and break complex activities in smaller components. this is important for the project manager because ,they can see the tasks more effectively than the complex activities.
The purpose of developing a WBS and WBS Dictionary are :1)It can help project team to plan logically and complete the project 2) It will help to gather documents and information about work that needs for doing the project 3) some activities are so complex WBS can cause these activities become organize and manageable so we can achieve project objectives.  The WBS and WBS Dictionary are not the schedule, but rather the building blocks to it. The progression of WBS and WBS Dictionary development is as follows:

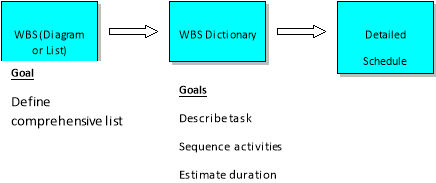
The contents of WBS are scope management plan, project scope statement , requirements documentation, Enterprise Environment Factors, Organizational Process Assets.
WBS include some items, those items are approved through scope statement should detail the full scope of work needed to complete. Breaking down can help us to estimate project cost and time and allocating resources, determining quality control.
We need two tools for create WBS process 1)decomposition 2)expert judgment
Decomposition :is involves breaking down the deliverables into smaller The first level of decomposition is the major deliverable level or subproject level, the second level of decomposition is a further elaboration of the deliverables. Decomposition will occur in five process
1)Identify the deliverables and work 2)Organize the WBS 3)Decompose the WBS components into lower -level4) Assign identification codes.5)Verify the WBS
WBS levels:
Project manager will determine the number of levels of WBS base on complexity of the project .In a WBS, every level item has a unique assigned number so that work can be identified and tracked over time. A WBS may have varying numbers of decomposition levels, but there is a general scheme for how to number each level so that tasks are uniquely numbered and correctly summarized. Below is the general convention for how tasks are decomposed:
Level 1 – Designated by 1.0. This level is the top level of the WBS and is usually the project name. All other levels are subordinate to this level.
Level 2 – Designated by 1.X (e.g., 1.1, 1.2). This level is the summary level.
Level 3 – Designated by 1.X.X (e.g., 1.1.1, 1.1.2). This third level comprises the subcomponents to each level 2 summary element.  This effort continues down until progressively subordinate levels are assigned for all work required for the entire project.
8.Describe the purpose and contents of a project schedule
 Scheduling will tell us how to finish in a certain time usually with defined stages, and defined resources. schedule can help us to calculate cost, set expectations plans and coordinate track and report. The schedule shows where you are along the road to “done,” how much work is left to be accomplished, how much has been accomplished, who is doing this future work, what they are delivering, and when they plan to deliver it. How to make schedule :


Step One: Define Activities
The goal of the activity definition step is to identify all the tasks required to accomplish the product. In level 3 of WBS(data base) create tables and populates tables.
Step Two: Sequence Activities
1)Do I have anytime to constraint?
2)What is the relationship between activities?
3)Which activity can be done in parallel?
Step Three: Estimate Activity Resources                                Step four: Estimate activity duration
1)Which is the sequence?                                              1)what is the level of skill of each resource assigned
2)Which are my restrictions (cost/time)?                    2)To finalized each activity do we need
3)For each activity who do I need?
Step five: develop schedule:
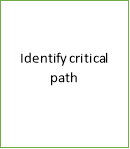

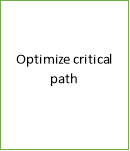
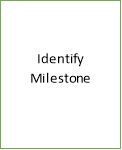
9)Describe the purpose and contents of a project budget?
The purposes of budgeting are for resource allocate resources, planning, coordination, control and motivation. It is also a vital tool for decision making method and monitoring business performance and forecasting income and expenditure. With proper budgeting, limited resources are managed efficiently.
Input for determined budget :
Cost Management Plan:
It will show us how we can develop , manage , controlled project costs during project.
Scope Baseline:
Scope baseline includes the project scope statement, the WBS, and the WBS dictionary. The scope                                   escribes the constraints of the project you should consider when developing the budget
Basis of Estimates:
It will cover all detail about estimate such as indirect costs.
Project schedule:
Project schedule will give you helpful information about start and end dates , milestones and
by these information yon determine budget expenditures .
Resource Calendars:Resource calendars will help you define costs in
calendar periods and over the length of the project .They help you to what resources you need.
Risk Register:
Before preparing budget you should consider list of risk that could happen during the projects.
Specially risks with high impact or high probability they could add cost to the project.
Agreements :
all cost information such as buying product , services,…
Organizational Process Assets will assist you with the work of this process include cost budgeting tools,
the policies and procedures your organization (or PMO) may have regarding budgeting exercises.
Budget Process Outputs:
1)Cost baseline
2)Project funding requirements
3)Project documents updates
We’ve covered the project documents updates in other processes. For Determine Budget, you may   need to update the risk register, cost estimates, and/or the project schedule.


10.Describe the concepts of probability and impact in risk analysis using a specific example
Analysis Risk
When the risk identified, the next step is risk analysis. By using risk analysis, we can transform the identified risks into decision-making information. As a result , each risk is considered and a judgment made about the probability and the seriousness of the risk.
For each risk, the team must do the following:
1)Assess the probability of a loss occurring. Some risks are very likely to happen and in the other hand some are very unlikely. Apply a scale that can reflects the perceived likelihood of a risk. Depending upon the degree of detail desired and/or possible, the scale can be numeric, based on a percentage scale, such as “10 percent likely to lose a key team.
Team should apply a set numerical probability for each qualitative value (e.g. very improbable= 10 percent, improbable = 25 percent)
2)Assess the impact of the loss if the loss were to happen. Then we can estimate the result of risk
|
Impact |
|||||
|
possibility |
Trivial |
Minor |
Moderate |
Major |
Extreme |
|
Rare |
Low |
Low |
Low |
Medium |
Medium |
|
Un likely |
Low |
Low |
Medium |
Medium |
Medium |
|
Moderate |
Low |
Medium |
Medium |
Medium |
High |
|
Likely |
Medium |
Medium |
Medium |
High |
High |
|
Very likely |
Medium |
Medium |
High |
High |
High |
Risk management is a very important function in today’s business world. A probability impact matrix is one of the management tools to evaluate risks in terms of their probability and extent of their impact. In addition, it is a useful framework to decide which risk requires more attention in an organization.
The inputs in the probability chart are derived from risk assessment form. So, it can be said the process of making this chart is simple. Probability chart is a table shaped form which incorporates various colors to indicate the probability and impacts of various risks. It has categorized risks into four groups as extreme, high risk, medium and low risk. The detailed explanation of these risks are given below:
- Extreme: These risks are marked with R (red color) in the chart and considered as high priority of importance. Company should give close attention and take early steps to eliminate this kind of risks completely.
- High risk: These kind of risks also require immediate actions or risk management strategies. In the probability impact matrix, these are characterized as H symbol and highlighted in the pink cells. If it is not possible to act immediately to reduce these risks then strict time line should be made to avoid the adverse effects produced from these risks.
- Medium: These risks are denoted by the first letter of medium “M” and marked in the orange cells. As the name suggested, these kind of risks are characterized middle in the scale of importance. Company don’t have to resolve medium risk immediately like extreme and high risk categories. Smart thinking, logical planning these strategies work best to reduce medium risk in an effective manner.
- Low risk: These kind of risks are marked as L and placed in the green cells in the probability impact matrix. Low risks require less attention compared to other categories and can be ignored without having any adverse effect. But company can implement any available controlling mechanism to reduce low risk.
the risk exposure can be calculated. Risk exposure is calculated as follows Risk Exposure (RE) = P Ã- C
EXAMPLE: Imagine furniture factory
|
Rank                         Risk                                                       Probability         Impact   Risk exp          Action |
|
1.                      Delay in shipment                                          50%                $ 1000       $ 5000            Weekly status meeting |
|
2                   Requirements changes                                     40%                 $ 7000      $ 2800             Bi-weekly deliverables. |
|
3.             Aggressive performance requirements              30%                $ 9000        $2700          Prototyping, performance testing |
|
4.                   Lose team member                                            5%                $50000       $2500                    Pair programming |
|
5. Unsure of desired graphical user interface pattern        5%                $1000            $50              Design with the Model-View    Controller |
:
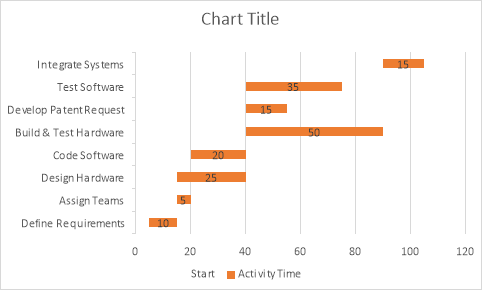
11.Given the following activity information, draw a Gantt chart.
|
Activity |
Description |
Preceding Activity |
Activity Time |
|
A |
Define Requirements |
None |
10 workdays |
|
B |
Assign Teams |
A |
5 |
|
C |
Design Hardware |
A |
25 |
|
D |
Code Software |
B |
20 |
|
E |
Build & Test Hardware |
C |
50 |
|
F |
Develop Patent Request |
C |
15 |
|
G |
Test Software |
D |
35 |
|
H |
Integrate Systems |
E, F, G |
15 |
Days
|
5 |
10 |
15 |
20 |
25 |
30 |
35 |
40 |
45 |
50 |
55 |
60 |
65 |
70 |
75 |
80 |
85 |
90 |
95 |
100 |
|
A |
|||||||||||||||||||
|
B |
|||||||||||||||||||
|
C |
|||||||||||||||||||
|
D |
|||||||||||||||||||
|
E |
|||||||||||||||||||
|
F |
|||||||||||||||||||
|
G |
|||||||||||||||||||
|
H |
- Given activity cost and time estimates, make a time-phased budget
|
Activity |
Number of Workers |
Daily Rate |
Hardware Costs |
|
A |
5 |
400 |
0 |
|
B |
5 |
400 |
0 |
|
C |
10 |
400 |
0 |
|
D |
20 |
200 |
0 |
|
E |
20 |
200 |
500,000 |
|
F |
1 |
800 |
0 |
|
G |
10 |
200 |
0 |
|
H |
10 |
200 |
0 |
|
Activity |
5 |
10 |
15 |
20 |
25 |
30 |
35 |
40 |
45 |
50 |
55 |
60 |
65 |
70 |
75 |
80 |
85 |
90 |
95 |
100 |
total |
|
A |
10000 |
10000 |
20000 |
||||||||||||||||||
|
B |
10000 |
10000 |
|||||||||||||||||||
|
C |
20000 |
20000 |
20000 |
20000 |
20000 |
100000 |
|||||||||||||||
|
D |
20000 |
20000 |
20000 |
20000 |
80000 |
||||||||||||||||
|
E |
520000 |
20000 |
20000 |
20000 |
20000 |
20000 |
20000 |
20000 |
20000 |
20000 |
700000 |
||||||||||
|
F |
4000 |
4000 |
4000 |
12000 |
|||||||||||||||||
|
G |
10000 |
10000 |
10000 |
10000 |
10000 |
10000 |
10000 |
70000 |
|||||||||||||
|
H |
100000 |
100000 |
100000 |
300000 |
|||||||||||||||||
|
total |
10000 |
10000 |
30000 |
40000 |
40000 |
40000 |
40000 |
534000 |
34000 |
34000 |
30000 |
30000 |
30000 |
30000 |
20000 |
20000 |
20000 |
100000 |
100000 |
100000 |
1292000 |
|
cost |
|
|
20000 |
A |
|
10000 |
B |
|
100000 |
C |
|
80000 |
D |
|
700000 |
E |
|
12000 |
F |
|
70000 |
G |
|
30000 |
H |
- You are responsible for managing an advertising and promotion project with the following activities (times are given in weeks).
|
Project |
Immediate |
Optimistic |
Most Likely |
Pessimistic |
Expected |
S |
|
s    Activity |
Predecessor(s) |
Time |
Time |
Time |
Time |
|
|
A |
none |
2 |
5 |
14 |
6 |
2 |
|
B |
none |
8 |
11 |
14 |
11 |
  1 |
|
C |
A |
5 |
7 |
9 |
7 |
0.66 |
|
D |
A |
6 |
9 |
12 |
9 |
1 |
|
E |
B, C, D |
1 |
3 |
5 |
3 |
0.66 |
|
ES |
Activity |
EF |
|
|
LS |
duration |
TF |
LF |
PERT : Tc = ( To + 4*Tm + T p ) / 6
 S = ( T p – To ) / 6
|
6 |
C |
13 |
|||
|
|
6 |
7 |
0 |
15 |
|
|
0 |
A |
6 |
|
||
|
0 |
6 |
||||

