Financial Evaluation of the State of California
There are numerous challenges facing the world such as globalization, urbanization, and climate change. California has taken excellent steps to address the global challenges while setting itself as the world’s most diverse and dynamic economy. California is the eighth-largest economy compared to other nations, with an equivalent gross domestic product (GDP) greater than Brazil. California’s 2015 GDP is $2.46 trillion and it is the third among 50 US states as per index report based on factors related to innovation and knowledge-based industries. 2014 GDP was $2.3 trillion. California’s economy was booming with a 3.29% growth rate in 2015 which was even several times higher than big countries like UK, France, Japan, Germany and even US. In 2014, California exported $174.1 billion in products and the top five exports were computers and electronic products, transportation equipment, machinery, miscellaneous manufactured commodities, and chemicals. Due to the most diverse availability of natural, cultural and recreational resources in the nation, visitors spent more than $1.7 billion in 2014. Its economy is projected to grow significantly over the next five years.
California had developed the most jobs for any state in US (483k) and at a rate faster than the world’s developed economies. The growth in employment rate was almost triple the job creation rate for the 19 countries that make up the euro zone and more than 3.5 times that of Japan, according to data compiled by Bloomberg. California has four of the world’s 10 largest companies. The government is proving that there is no resistance for business and investment in spite of the presence of high tax rates and excessive regulations.
The largest industries in California in 2015 were finance, insurance, real estate, rental and leasing. These accounted for 21.5% of California GDP and had 0.2% real growth. Professional and business services, being the second largest industry accounted for 13.1% of California GDP and had 6.5% real growth. 2015 was the fourth consecutive year of drought which resulted in the first decrease in farm employment. The State’s revenues were far above the estimates indicating a very successful year and the GAAP positive balance for the past thirty years substantiates the good performance of the state and its liquidity as well.
Economic Outlook:
The State of California posted a 5.5% income growth compared to 4.6% increase for the entire US.
- Increase in consumer spending. 9.9% increase in automobile registrations (6.6% increase year over year). 1.9 million new vehicle registrations recorded
- Real estate market improved significantly
- Prices of single family homes increased by 7% and sales were 11% higher compared to prior year
- Homebuilding permits increased by 10%
- Nonresidential construction increased by 4.1%
- Labor market showed positive sign
- Unemployment rate of 6.3% in June 2015, compared to 7.5% in June 2014
- 17.8 million jobs created in fiscal year 2015, compared to 481000 jobs in June 2014
- Most employment opportunities in the following sectors – Hospitality, Leisure, Health Services, Education, Business service, and government
California’s financial position is healthy for the year ended June 30, 2015 as the economic expansions out-paced that of many other states and its general revenues exceeded all budget projections. The state’s general revenues increased by $12.7 billion which is 10% higher over the prior year. Expenses and transfers includes a combined $15.8 billion increase in the primary government’s net position ($13.1 billion increase in State’s governmental activities and $2.7 billion increase in State’s business-type activities) compared to prior year. Government ended with a net deficit position of $41.0 billion. This combined net deficit position was decreased by a whopping 659% which is $48.3 billion to a negative $41.0 billion compared to 2014, but increased by $15.8 billion when adjusted for restatements taking into account unreported net pension liability for 2014. Financial performance reveals that the State may find itself difficult to pay off its obligations using the available resources.
Financial Ratio Analysis:
Liquidity Ratio: 0.93.
- Liquidity ratio less than 1.0 means the government may fail to pay its obligations in the long run.
Debt Service Ratio: 0.26
- The ratio is above 0.2 and it indicated that the government may not be in a position to service its current debts using its operating revenues
Current Ratio: 1.55
- Since the ratio is above 1.0, the current assets can meet fully the current liabilities
- Government is in a position to pay for its short-term obligations through liquidating its current assets
Debt to Asset Ratio: 1.15
- State assets increased from $220.2 billion in 2014 to $231.5 billion in 2015. Liabilities increased for the same period causing a deficit in net assets.
- Since the debt to asset ratio increased from 0.97 to 1.15 indicating that more number of assets are covered by debts signaling that the government is in a deteriorating position compared to prior year.
The total net deficit position is reduced by $103 billion for net investment in capital assets and by $31.0 billion for restricted net position, yielding a negative unrestricted net position of $175.1 billion. The government’s $103.0 billion net investment in capital assets, such as land, buildings, equipment, and infrastructure constitutes a significant portion of its net position. Restricted net position represents resources that are externally restricted for specified uses and is not available to fund current activities. As of June 30, 2015, the government recognized more than 51% ($89.9 billion) of the negative $175.1 billion in unfunded employee-related obligations – net pension liability, net other postemployment benefits obligations, and compensated absences. Another 38.3% ($67.1 billion) is recognized in outstanding bond debt issued to build capital assets for school districts and other local governmental entities. Since the state does not own these capital assets, the bonded debt is reported as a noncurrent liability that increases the State’s unrestricted net deficit position.
The expenses totaled $259.7 billion for the fiscal year ending June 30, 2015. 52.5% of this amount which is $136.5 billion was funded with program revenues (program specific grants) and the remaining $123.2 billion to be funded with general revenues, mainly taxes. The government’s general revenues of $139.0 billion exceeded the unfunded expenses by $15.8 billion leading to a 27.8% increase in net position.
-
Government-wide Financial Statements:
- Governmental Activities Revenues and Expenses:
During fiscal year ending June 30, 2015, the net deficit for governmental activities improved $13.1 billion over the prior fiscal year’s restated amount, for an ending deficit position of $42.4 billion.
For the fiscal year 2014-2015,
- Total state tax revenues collected for governmental activities increased by $12.8 billion over prior year.
- Increase in personal income taxes ($9.3 billion) was due to individual personal income increase and capital gains realization increase from good stock market and real estate performance.
- Sales and tax revenue increased by $1.7 billion due to increased State’s population and per capita consumption of taxable goods.
- Corporate taxes increased by $1.6 billion due to increased corporate profits
Overall expenses increased by $24.1 billion over the prior year. The largest increase in expenditures is attributed to Department of Health Care Services. The other major increase ($4.8 billion) in expenses was in Education spending which was triggered by higher general fund revenue.
- Business-Type Activities Revenues and Expenses:
During fiscal year ending June 30, 2015, the net deficit for business type activities improved $2.6 billion over the prior fiscal year’s restated amount, for an ending deficit position of $1.5 billion. The revenue and transfer amounts were sufficient to meet the expenses. Overall expenses decreased by $1.5 billion over the prior year. The decrease in expenses was mainly in the unemployment programs division as the unemployment rate came down compared to prior year.
2. Fund Financial Analysis:
2.1. Governmental Funds Financial Analysis:
The Government’s governmental funds’ balance increased by $6.3 billion to $26.1 billion over the prior fiscal year, as restated. The unrestricted fund balance, comprised of committed, assigned, and unassigned balances was negative $448 million. The nonspendable and restricted fund balances were $59 million and $26.5 billion, respectively.
Governmental funds balance sheet trends compared to prior year (2015 Vs 2014)
- Total assets of governmental funds increased by 5.0%
- Total liabilities and deferred inflows of resources decreased by 4.8%
- Total fund balance increased by 31.5%
- $59 million is classified as nonspendable as this consists of long-term interfund receivables, loans receivable, or legal or contractual requirements
- $26.5 billion is classified as restricted for specific programs by external constraints, enabling constitution, etc.
- $4.2 billion is classified as committed for specific purposes
- $17 million is classified as assigned for specific purposes
- Negative $4.7 billion is the unassigned balance of the governmental funds
Statement of revenues, expenditures, and changes in fund balances comparison for 2015 over 2014
- Reported revenue was $249.9 billion
- Personal income taxes increased by 13.7%
- Sales and use taxes increased by 5.5%
- Corporation tax increases by 17.4%
- Reported expenditures was $248.8 billion
- Overall increase was $30.0 billion, primarily for education and health and human services
- Reported other financing sources were $ 4.7 billion
- General obligation bonds and commercial paper was $6.7 billion, 8.9% decrease.
- Reported ending fund balance of $26.1 billion with an increase of $6.3 billion over 2014
The State’s major governmental funds are the General Fund, the Federal Fund, the Transportation Fund, and the Environmental and Natural Resources Fund.
2.1.1 General Fund Financial Analysis:
General funds balance sheet trends compared to prior year (2015 Vs 2014)
- Fund deficit of $2.2 billion, improvement of $5.2 billion over prior year
- Total assets increased by $2.8 billion
- Total liabilities decreased by $2.4 billion
- Total net fund balance decreased by $5.2 billion
Statement of revenues, expenditures, and changes in fund balances comparison for 2015 over 2014
- Reported revenue was $116.8 billion, increased by $12.6 billion (12.1%)
- Personal income taxes increased by 13.8% ($9.3 billion)
- Sales and use taxes increased by 6.1% ($1.4 billion)
- Corporation tax increases by 16.6% ($1.5 billion)
- Reported expenditures was $107.1 billion, increased by $11.8 billion (12.4%)
- Major increase is in education ($9.7 billion)
- General government expenditure ($1.0 billion)
2.1.2. Federal Fund Financial Analysis:
The federal fund reports federal grant revenues and the related expenditures to support the grant programs.
- Reported revenue was $86.2 billion, increased by $14.8 billion (20.7%) over 2014
- Reported expenditures was $85.4 billion
- Largest expenditure program was health and human resources ($73.3 billion)
- Education program accounts to $7.0 billion
- Reported fund balance increased by $6 million over 2014
2.1.3. Transportation Fund Financial Analysis:
The transportation fund accounts for fuel taxes, bond proceeds and other revenues used primarily for highway and passenger rail construction.
- Reported revenue was $10.5 billion, decreased by 2.1% over 2014
- Reported expenditure was $12.4 billion, decreased by 2.9% over 2014
- Reported other financing sources of $2.6 billion
- Reported year ending fund balance of $8.2 billion, an increase of $751 million over 2014
2.1.4. Environmental and Natural Resources Fund Financial Analysis:
This fund accounts for fees, bond proceeds, and other revenues used for maintaining the State’s natural resources and to improve the environmental quality of its air, land, and water.
- Reported revenue was $5.0 billion; Reported expenditure was $5.2 billion
- Reported other financing sources of $881 million
- Reported year ending fund balance of $8.4 billion, an increase of $658 million over 2014
2.2. Proprietary Funds Financial Analysis:
Due to implementation of GASB Statement No. 68 and Statement No. 71, beginning net position was decreased by $7.3 billion ($6.5 billion for enterprise funds and $791 million for internal service funds)
2.2.1. Enterprise Funds:
- Total net position was $1.5 billion, increase of $2.7 billion compared to prior year
- Unemployment programs fund had a decrease in its net deficit position of $2.0 billion
- California State University fund and non-major enterprise funds was increased by $497 million and $156 million respectively
Enterprise funds balance sheet trends are as follows
- Fund deficit of $2.2 billion, improvement of $5.2 billion over prior year
- Total assets was $35.3 billion
- Total liabilities was $33.8 billion
- Largest liabilities were revenue bonds payable ($12.7 billion), net pension liability ($6.2 billion), and non-current loans payable ($5.7 billion)
- Total net position
- Net investment in capital assets ($2.3 billion)
- Nonexpendable restricted net position ($13.0 billion)
- Restricted expendable net position ($4.5 billion)
- Unrestricted net deficit ($5.4 billion)
Statement of revenues, expenditures, and changes in fund net positions comparison for 2015 over 2014
- Reported revenue was $22.9 billion
- Unemployment and disability insurance ($13.4 billion), decreased by 1.8 billion
- Lottery ticket sales ($5.5 billion)
- Reported expenditures was $22.9 billion
- Distribution to beneficiaries ($11.1 billion)
- Personal services ($4.2 billion)
- Lottery prizes ($3.5 billion)
- Reported net expenses from other transactions was $66 million
2.2.2. Internal Service Fund:
Internal service fund balance sheet trends are as follows
- Total net deficit was $209 million
- Total net position
- Net investment in capital assets ($292 million)
- Restricted expendable net position ($142 million)
- Unrestricted net deficit ($642 million)
Statement of revenues, expenditures, & changes in fund net positions comparison for 2015 over 2014
- Reported revenue was $3.4 billion
- Services and Sales ($2.9 billion)
- Rent ($454 million)
- Reported expenditures was $3.3 billion
- Services and Charges ($2.0 billion)
- Personal services ($753 million)
2.3. Fiduciary Funds Financial Analysis:
California State has four types of fiduciary funds. Combined fiduciary funds net position was $541.5 billion, a $4.2 billion increase over 2014 mainly due to the contributions and investment income in pension and other employee benefit trust funds exceeded payments made to participants.
- Private purpose trust funds
- Net position was $6.5 billion
- Pension and other employee benefit trust funds
- Net position was $513.5 billion
- Investment trust funds
- Net position was $21.5 billion
- Agency funds
- No net position as they act as clearing account funds
Major Programs and Functions of the State:
The economic expansion of California during 2014-2015 has outpaced that of many other states in US and its general revenues increased by $12.7 billion which 10% higher than the prior year.
Activities under Government-wide Financials:
The government-wide financials were reported as three types of state programs and activities – Primary government (Governmental activities and Business type activities), and Component Units.
A primary government is a separately elected governing body, and is fiscally independent of other state or local governments.
- Governmental Activities: These activities are mainly supported by taxes, such as personal income and sales and use taxes, and intergovernmental revenues, primarily federal grants.
- Business-type Activities: Activities that are charged with a fee to external users of goods and services.
- Component units: Organizations that are legally separate from the State, but related to the State financially. Legally separate organization or which the elected officials of a primary government are financially accountable. Reporting component unit is as significant as their exclusion would cause the State’s financial statements to be misleading or incomplete. Financial reporting of a component unit can be reported by discrete presentation as in a separate column or by blended presentation.

Programs under Fund Financial Statements:
Funds of the State can be divided into three segments: governmental funds, proprietary funds, and fiduciary funds.
Governmental Funds:
This fund type is used to account for activities primarily supported by taxes, grants, and similar resources which accounts the same functions that are reported as governmental activities in the government-wide financial statements, except governmental fund financial statements focus on short-term inflows and outflows off spendable resources, as well as balances of spendable resources available at the end of the fiscal year. This information is key in evaluating a government’s short-term financing requirements. Non-current assets such as land and buildings, and noncurrent liabilities such as bonded debt and amounts owed for net pension liability, compensated balances, and capital lease obligations are reported in government-wide statements, but not in the fund-based statements.
The State’s major governmental funds are, the General Fund, the Federal Fund, the Transportation Fund, and the Environmental and Natural Resources Fund.
The General Fund: Accounts the transactions related to the general government operation and it is the only one per government. It accounts for all transactions related to resources obtained except those required to be accounted for in another fund. The largest revenues and expenditures for this fund in comparison with prior year are as below:
- Reported revenue was $116.8 billion, increased by $12.6 billion (12.1%) over 2014
- Personal income taxes increased by 13.8% ($9.3 billion)
- Sales and use taxes increased by 6.1% ($1.4 billion)
- Corporation tax increases by 16.6% ($1.5 billion)
- Reported expenditures was $107.1 billion, increased by $11.8 billion (12.4%)
- Major increase is in education program ($9.7 billion) over 2014
- General government expenditure ($1.0 billion) over 2014
The Federal Fund: It accounts for the receipt and use of grants, entitlements, and shared revenues received from the federal government that are all restricted by federal regulations. The largest revenues and expenditures for this fund in comparison with prior year are as below:
- Reported revenue was $86.2 billion, increased by $14.8 billion (20.7%) over 2014
- Largest revenue generated was from Intergovernmental services
- Reported expenditures was $85.4 billion
- Largest expenditure program was health and human resources ($73.3 billion)
- Education program accounts to $7.0 billion
- Reported fund balance increased by $6 million over 2014
The Transportation Fund: This fund accounts for fuel taxes, fuel use taxes, motor vehicle, bond proceeds, automobile registration fees, and other revenues that are restricted for transportation purposes, including highway and passenger rail construction and transportation safety programs. The largest revenues and expenditures for this fund in comparison with prior year are as below:
- Reported revenue was $10.5 billion, decreased by 2.1% over 2014
- Largest revenue were motor vehicle excise taxes, and license and permits
- Reported expenditure was $12.4 billion, decreased by 2.9% over 2014
- Largest expenditure program was business and transportation ($10.8 billion)
- Reported other financing sources of $2.6 billion
- Reported year ending fund balance of $8.2 billion, an increase of $751 million over 2014
The Environmental and Natural Resources Fund: It accounts for fees, bond proceeds, and other revenues that are restricted for maintaining the State’s natural resources and improving the environmental quality of its air, land and water. The Safe Drinking Water State Revolving Fund represents 16% of the assets and deferred outflows, and 5% of the additions, revenues and other financing sources of the environment and natural resources fund. The largest revenues and expenditures for this fund in comparison with prior year are as below:
- Reported revenue was $5.0 billion
- Largest revenue was fees ($2.4 billion)
- Reported expenditure was $5.2 billion
- Largest expenditure was for resources ($4.1 billion)
- Reported other financing sources of $881 million
- Reported year ending fund balance of $8.4 billion, an increase of $658 million over 2014
Programs and functions of the governmental fund are listed below.
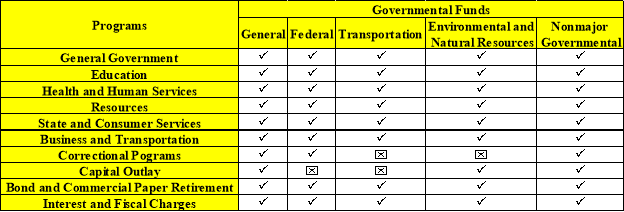
Non-major Governmental Funds:
The following are the different non-major governmental funds.
Special Revenue Funds:
- The Business and Professions Regulatory and Licensing Fund
- The Financing for Local Governments and Public Fund
- The Cigarette and Tobacco Tax Fund
- The Local Revenue and Public Safety Fund
- The Healthcare Related Programs
- The Trial Courts Fund
- The Golden State Tobacco Securitization Corporation Fund
- Other Special Revenue Programs Fund
Debt Service Fund:
- The Economic Recovery Bond Sinking Fund
- The Transportation Debt Service Fund
Capital Projects Fund:
- The Higher Education Construction Fund
- The Hospital Construction Fund
- The Local Government Construction Fund
Proprietary Funds:
These funds report activities that are more like those found in the private sector. The State of California has two proprietary fund types – enterprise and internal service funds.
Enterprise Funds:
These funds accounts for activities for which a fee is charged to external users (Examples: Electric and water utilities, airports, parking garages, transportation systems, and liquor stores); they are presented as business-type activities in the government-wide financial statements.
Major enterprise funds are
- Electric Power Fund
- Accounts for the acquisition and resale of electric power to retail end-use customers
- Water Resources Fund
- Accounts for charges to local water districts and the sale of excess power to public utilities
- State Lottery Fund
- Accounts for the sale of California State Lottery tickets and the Lottery’s payments for education
- Unemployment Programs Fund
- Accounts for employer and worker contributions used for payments of unemployment insurance and disability benefits
- California State University Fund
- Accounts for student fees and other receipts from gifts, bequests, donations, federal and state grants, and loans that are used for educational purposes
Enterprise Funds Financial Statement Analysis
- Total net position was $1.5 billion, increase of $2.7 billion compared to prior year
- Unemployment programs fund had a decrease in its net deficit position of $2.0 billion
- California State University fund and non-major enterprise funds was increased by $497 million and $156 million respectively
Statement of revenues, expenditures, & changes in fund net positions comparison (2015 over 2014)
- Reported revenue was $22.9 billion
- Unemployment and disability insurance ($13.4 billion), decreased by 1.8 billion
- Lottery ticket sales($5.5 billion)
- Reported expenditures was $22.9 billion
- Distribution to beneficiaries ($11.1 billion)
- Personal services ($4.2 billion)
- Lottery prizes ($3.5 billion)
- Reported net expenses from other transactions was $66 million
Internal Service Fund:
These funds account for activities in which goods or services are provided to other departments of the same government for a charge (Examples: Central stores, central computing, motor pools, and printing); reported as governmental activities in the government-wide financial statements because they mainly serve departments financed by governmental funds.
Following are the various internal service funds:
- The Public Buildings Construction Fund
- The Architecture Revolving Fund
- The Service Revolving Fund
- The Prison Industries Fund
- The Financial Information systems Fund
- The Technology Services Revolving Fund
- The Water Revolving Fund
Statement of revenues, expenditures, & changes in fund net positions comparison for 2015 over 2014
- Reported revenue was $3.4 billion
- Services and Sales ($2.9 billion)
- Rent ($454 million)
- Reported expenditures was $3.3 billion
- Services and Charges ($2.0 billion)
- Personal services ($753 million)
Non-major enterprise funds account for additional operations that are financed and operated in a manner similar to private business enterprises.
- The State Water Pollution Control Revolving Fund
- Accounts for loans to finance the construction of publicly owned water pollution control facilities
- The Housing Loan Fund
- Accounts for financing and contracts for the sale of properties to eligible California veterans
Programs under Fiduciary Funds:
This fund accounts for financial resources for which the government is acting in an agency capacity. It follows simple accounting methodology of assets equals’ liabilities. Example: Tax agency funds and pass-through agency funds.
California State has four types of fiduciary funds. Combined fiduciary funds net position was $541.5 billion, a $4.2 billion increase over 2014 mainly due to the contributions and investment income in pension and other employee benefit trust funds exceeded payments made to participants.
-
Private Purpose Trust Funds
- Accounts for financial resources (expendable or nonexpendable) in which the government is acting in a trustee capacity for private individuals, organizations, or other governments
- Net position was $6.5 billion
The following are the State’s largest private trust funds
- The Scholarshare Program Trust Fund
- Accounts for money received from participants to fund their beneficiaries higher education expenses at certain postsecondary educational institutions
- The Unclaimed Property Fund
- Accounts for unclaimed money and properties held in trust by the State.
-
Pension and other Employee Benefit Trust Funds
- Accounts for financial resources in which the government (or other designated trustee) is acting in a trustee capacity for the employees of the government to provide retirement benefits
- Net position was $513.5 billion
-
Investment Trust Funds
- Accounts for external investment pools in which the assets are held for other governments, along with funds of the sponsoring government
- Assets, liabilities, net assets, and changes in net assets related to the equity of the external participants are reported in this fiduciary fund
- Net position was $21.5 billion
-
Agency funds
- No net position as they act as clearing account funds
- Government merely transmits this fund as there is no direct financial interest in cash transmitted
The State’s largest agency funds are as below
- The Receipting and Disbursing Fund
- Accounts for the collection & disbursement of revenues and receipts on behalf of local governments. It also accounts for receipts from numerous state funds, mainly for the purpose of writing a single warrant when the warrant is funded by multiple funding sources
- The Deposit Fund
- Accounts for various deposits, such as those from condemnation and litigation proceedings
Funds under Component Units:
- Blended Component Units: Though it is legally separate, it is part of the primary government’s operations.
- The Golden State Tobacco Securitization Corporation is a non-for-profit corporation established mainly for the purpose of purchasing Tobacco Settlement Revenues from the State.
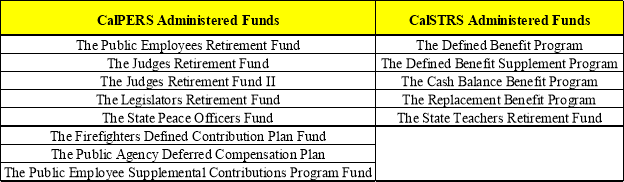
- Fiduciary Component Units: The State has two legally separate fiduciary component units that administer pension and other employee benefit trust funds.
- The California Public Employees Retirement System (CalPERS)
- The California State teachers Retirement System (CalSTRS)
- Discretely Presented Component Units:
These are legally separate from the primary government and usually provide services to entities and individuals outside the primary government.
Enterprise activities that include are
- University of California
- California Housing Finance Agency
- Non-major Component Units
- Financing Authorities
- The California Alternative Energy and Advanced Transportation Financing Authority
- The California Infrastructure and economic development bank
- The California Urban Waterfront Area Restoration Financing Authority
- District Agricultural Associations
- California State University Auxiliary Organizations
- Other Component Units
- University of California Hastings College of the Law
- The State Assistance Fund for Enterprise, Business, and Industrial Development Corporation
- The Public Employees Contingency Reserve
- Financing Authorities
Significant Accounting Policies:
The information on the financial statements of the State of California was prepared in compliance with Generally Accepted Accounting Principles (GAAP) and some of the provisions of Governmental Accounting Standards Board (GASB) for the year ended June 30, 2015. Summary of significant accounting policy mentioned in the financials of the state comprises different reporting entities based on their component units, government wide and Fund financial statements.
The most significant accounting policy used in governmental financial statements is GAAP.
The provisions of GASB statements implemented for the year 2015 were:
- GASB Statement No. 68, Accounting and Financial Reporting for Pensions.
It is an amendment of GASB Statement No. 27, Accounting for pensions by State and local governmental employers, and No. 71, Pension Transition for Contributions Made Subsequent to the Measurement Date. The key objective of these statements is to improve accounting and financial reporting by state and local governments for pensions. The main purpose of these statements improves state and local governments for pensions by establishing certain standards for measuring and recognizing net pension liability, deferred outflows of resources and expenses/ expenditures. It also identifies the methods and assumptions that should be considered to project benefit payment plan and discount projected benefit payment plan.
- GASB Statement No. 69, Government Combinations and Disposals of government operations.
This statement mainly refers to various arrangements including mergers and acquisition, transfer of operations in shared service arrangements, reorganizations, redistricting and annexations in all state and local governmental entities. Government combinations also include transfers of operations that do not constitute entire legally separate entities and in which no significant consideration is exchanged. This statement establishes accounting and financial reporting standards related to government combinations and disposals of government operations. In addition, this statement provides accounting and financial reporting guidance for disposals of government operations that have been transferred or sold. Disclosures about government combinations and disposals of government operations to enable financial statement users to evaluate the nature and financial effects of those transactions are required for this statement.
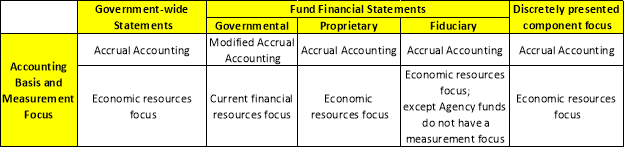
Accounting Basis for Government-Wide and Fund Financial Statements:
The Government-wide financial statements were reported using accrual basis of accounting. Regardless of the timing of the related cash flows, revenues are recorded when they are earned and expenses are recorded when a liability is incurred. Grants and similar transaction are recognized as revenue as soon as all the eligibility requirements have been met.
The basis of accounting for the fund financial statements vary with the type of fund. Modified accrual basis of accounting were used to report the accounts of the governmental fund types. Under this mode of accounting, revenues were recorded as they become measurable and available, and expenditures were recorded at the time the liabilities were incurred. In cases where an asset is recorded in a governmental fund statement, but the revenue is not available within the ensuing 12 months, the State reports a deferred inflow of resources until such the time the revenue becomes available.
The State uses GAAP principles to report investments at fair value.
Accounting Basis for Inventories:
In the government-wide financial statements, inventories are expenses when they are consumed and unused inventories are reported as an asset on the Statement of Net Position for both governmental and business-type activities. In the fund financial statements, inventories are reported as expenditures when purchased in governmental funds and as expenditures when consumed in proprietary funds. The inventory policies for discretely presented component units are similar to those of the primary government.
GASB Statement No. 54 was used to report fund balance in the financial report for which the State considers the classifications in the following order when an expenditure is incurred: restricted, committed, assigned and unassigned.
Implementation of GASB Statement No. 68 and NO. 71 led to the recognition of net pension liability and deferred outsource of resources in all applicable funds.
Financial Issues in the State of California:
Some of the critical issues California is facing currently are
- Water Supply: Unreliable water supply and outdated infrastructure
- Debt Level: Understated Debt and mountain to climb
- Public Retirement Benefits: Missed payments, mounting debts, and poor management
- Healthcare: Increasing costs and diminishing access to care
- High-Speed Rail: Unrealistic estimates and poor implementation
- Economy: Slow recovery and uneven economic growth
- Revenue Uncertainty: Unpredictable tax structures and budgets
The State of California has extreme range of climates ranging from deserts to mountain ranges to beaches. Drought conditions in California is as expected and it will last several years. The State has experienced severe drought conditions with below-average precipitation. Consequences of this case is not only the lack of water, but forest fires and wild fires were prevalent which will have a significant impact on the State’s agricultural community. Statewide water conservation, facilitating water management, and providing funding for critical water infrastructure projects were some of the mandatory steps taken by the government to tackle the drought conditions. Problems which the State would face when eventually it receives rain would be damaged properties, roads, mobility issues, and other infrastructural problems. The State of California has included a total of $720 million in the budget towards new General Fund resources to pay for the wildfires and drought effects. One such example was the recent water spillway accident due to the storm condition prevalent in the State. Owing to the State’s climatic conditions, money needs to be set aside in the budget to deal with the consequences of drought and flood conditions.
California is a State which has stricter emission regulations compared to all other states in US. California Air Resources Board (CARB) has constantly put the State on watch and has come up with remedial measures to reduce vehicle emissions working in collaboration with Environmental Protection Agency (EPA). EPA projections show that 14 out of 28 counties in California will not meet 75ppb ambient ozone standards in 2020. Providing clean air to the state is a necessity and a must requirement for future generations to come as well. CARB has been working with several research organizations to meet lower emissions level and even persuading EPA to implement tougher regulations. The budget contains $3.1 billion towards reduction of greenhouse gas emissions through various programs that support clean transportation, and protect ecosystems. The California Global Warming Solutions Act of 2006 (AB 32), addresses climate changes and set greenhouse reductions goals for 2020. Depending on whether the greenhouse gas reduction goals have been met or not, continuation of goals or more aggressive approach would be taken to meet the target goal set for 2020. Greenhouse gas and vehicle emissions reduction within the prescribed timeline would be a challenge that the State government has to face over the next few years.
State has initiated a new plan for health care and dental benefits to retired state employees and their spouses and dependents with “prefunding” operation from “pay-as-you-go” plan. These “Other Post-Employment Benefits” (OPEB) with prefunding initiative would be shared equally between state employers and employees which includes new employee’s retiree health benefits that are being negotiated. The actuarial accrued liability was estimated to be $72 billion at the end of fiscal year 2014 and it was estimated to be $74 billion at the end of fiscal year 2015. This major change will take several decades to completion and require comprehensive plan and strategy.
The State of California had to defer spending in non-significant programs due to the economic downturn that happened in 2008. The State’s revenues had to be greatly reduced at that time. Since the economy has recovered and the State has put in place a robust infrastructure plan with a proposal of close to $36 billion to be spent over the next decade to fix the state and local transportation needs. Once the neighborhood roads and state highways repair work is complete, the State would move towards State and local transportation. The plan had proposed $4.0 billion for transit and intercity rails. Funding of $25.2 billion from federal, Cap and Trade, and Proposition 1A bond and various other sources were proposed in the plan for High Speed Rail project. This project faces substantial financial, legal, operational, and even political challenges that show a serious lack of foresight and responsible governance. The estimated $67.6 billion project has been in its initial planning and development phase for the past two decades. Allocating budget and finding ways to allocate money for this high efficiency plan would be a challenge California has to face especially with just an A rating. Its inability to secure funding, high potential for cost overruns, and limited capacity to operate as a self-sustaining system all illustrate that the project’s implementation over two decades has been both haphazard and ineffective.
References:
- High Speed Rail – Unsustainable California: The top 10 Issues Facing the Golden State
- State of California Comprehensive Annual Financial Report, June 30, 2015
- California Makes America’s Economy Great – Bloomberg View