Findings Chapter on Resilience Research
4Chapter four: Stage 1 – qualitative data collection, analysis and empirical findings
4.1Introduction
This chapter discusses the first stage of empirical study, including its data collection, data analysis and findings.
This chapter discusses how different data collection and analysis methods were used during the research to find answers to the research questions. In particular, this chapter describes the use of semi-structured interview method to collect data for the research (next section). Sampling techniques used for the study are discussed, followed by the development of interview questions and process of conducting interviews. Then the qualitative data analysis approach will be discussed. Empirical findings of the stage one are presented and explained in detail. This chapter will also highlight the contribution to the concept of resilience. This would be achieved through incorporating empirical findings to refine the Proactive Performance Measurement for SC resilience (2PM-SCR) framework earlier developed from the literature. Four matrices have been developed to define the relations between the three main constructs of supply chain resilience: risks, KPIs, and capabilities.
4.2Sampling technique
The number and content of interviews was based non-probability sampling techniques; Purposive (Judgmental), and Snowball sampling. The initial participant sample is based on the participant’s interest to participate in the research. In purposive sampling, participants were selected based on pre-selected criteria which will best enable the researcher to answer the research questions. Thus, purposive sampling ensures adequate representation of important themes. Then each interviewee was asked towards the end of the interview whom they may think would be suitable for a similar interview and who may be knowledgeable about the phenomena (snowball sampling). Thus, recommendations will be taken from people who know people who know that they are suitable for similar lines on questioning around the research framework.
Purposive sampling represents a group of different non-probability sampling techniques. Also known as judgmental, selective or subjective sampling, purposive sampling relies on the judgement of the researcher when it comes to selecting the units (e.g., people, cases/organisations, events, pieces of data) that are to be studied. Usually, the sample being investigated is quite small, especially when compared with probability sampling techniques.
In purposive sampling technique, the suitable interview participants were identified through industry contacts after they have been assessed based on the following criteria as stated earlier:
- The sample should be from the FMCG industry covering any of the FMCG categories such as (Food, Home, Personal Care, Agriculture, Retail, Medicinal Herbs, Bakery, Beverages, Dairy products, fast food)
- The company must be at least medium-sized (From 10 to 249 Employee) or Large-sized (Greeter than 249 Employees).
- SC manager interviewed must have a level of experience of more than 5 years.
- Company Type / Function ( Manufacture – Distributor – Supplier – Retailer)
- To cover at least 3 categories of FMCG
- The sample should provide access to its key information (primary data)
In application to my research, two informal meetings were conducted with experts from the SC Council Middle East Chapter based in Egypt. I was recommended to look for 35 companies from the FMCG that have appropriate SC activities. So I have emailed all the 35 companies and I have got 25 responses out of the 35 that were willing to participate in my research. From those 25 companies, 5 companies were neglected because either their SC activities are very limited or the people involved in the SC activities have less than 5 years of experience which will subsequently give a lack of understanding of the issue of y research. After the 25 companies were chosen, snowball sampling was obtained by asking participants to suggest someone else who was appropriate for the study. For example, Americana Olives SC manager was asked to suggest other companies which could contribute to the research, he recommended Americana Cakes’ SC manager. Nevertheless, based on the researcher knowledge and judgement, some companies were found to be not suitable for this research.
In order to have a good sample to the research, 30 companies have been chosen that apply to the criteria’s that previously stated. The companies were selected by taking into consideration their position in the FMCG SC (i.e. supplier/manufacturer/distributor/retailer). It is essential to have companies that are continuously managing their SC in order to get a deeper understanding of the risks and different problems that face the entire network. The companies shall continuously manage their SC and be medium sized or big companies. It’s important to get interviews with people with the right competence within the company in order to get the most insight from the interviews.
Each expert who participated in the interview had direct involvement of the respective SCM position in MER and they all had direct work experience in supply chain for more than 10 years which indicates the high level of skills, in the field of supply chain.
The choice to use a smaller number of cases were deliberate as it makes it possible to have
a more in depth study of the cases and is in this case more suitable.
All interviewees were contacted over the phone by explaining the research topic, research questions, objectives and purpose of the interviews, in order to obtain their consent to participate in the interviews. All interviews were conducted on-site and were audio recorded with the consent of participants for word-for-word transcribing purposes. One interview was on average of 1.5 to 2 hours in duration. More information about the interviews will be discussed in the next section.
The data collection will help in generating theory by jointly collecting data and analysing them to be the building block of the iterative conceptual model. Saunders et al. (2009) suggest to continuingly collect qualitative data such as by conducting additional interviews, until data saturation is reached; in other words until the additional data collected provides few, if any, new insights.
In this study, interviews were conducted with 30 companies in the FMCG industry. Moreover, to cover different sectors in the industry; such as diary, food, retailers, and healthcare. Interviewing the 30 companies helped to gain adequate information to be able to generalize the findings.
Apparently, there was an intention to involve a larger sample size since different participants might have different opinions and perceptions. But as the same time, if a large sample is used, data becomes repetitive (Glaser and Strauss, 1967). This is called the saturation point when the collection of new data won’t add further insight to the research performed. The idea of data saturation in studies is important; nevertheless, it does not provide a practical guide for when this point has been touched (Guest et al., 2006). Moreover, authors argued that analysing interview results can be one of the methods that help to figure out the point at which data saturation has been attained (Bernard, 2012).
Thus, owing to the exploratory nature of this research, saturation was not less below the 30 companies interviewed since new risks, capabilities, and KPIs were explored based on the company’s place in the network (i.e. supplier/manufacturer/distributor/retailer) and the category of FMCG underneath the company falls.
4.3 Empirical data collection
After setting the criteria for the companies that could be part of this research, it has been assured that each SC manager who participated had direct involvement of the respective SCM position in MER and they all had direct work experience in SC for at least five years which indicated the high level of skills in the field of SC as previously stated in the previous section.
The 30 companies have experience in SC shown in Table 4.1 representing manufacturing, supplier, distribution and retail sectors in MER. The category, country, company, size, level of experience, and the type of the company are shown in the columns of Table 4.1. The number of employees’ column provides an indication of the company size. In other words, the sample consists of mid and large scale companies with various business natures. Moreover, an interview template (see Appendix 1) was developed and used for this study and there was always freedom for participants to express their ideas with respect to the context being discussed.
For further details about the background of the companies please check Appendix 1.
Table 4.1: Summary of the companies involved in the empirical phase
|
Category |
Country |
Interview with |
|||
|
Food |
8 |
Multinational |
15 |
Supply chain top and middle management |
5 |
|
Home and Personal Care |
1 |
Local |
15 |
Supply chain top management |
25 |
|
Food and Personal Care |
1 |
Company Size |
Type |
||
|
Agriculture |
1 |
Medium-sized |
2 |
Manufacture – Distributor |
13 |
|
Retail |
4 |
Large-sized |
28 |
Manufacture – Distributor – Supplier |
10 |
|
Agriculture and Medicinal Herbs |
1 |
Experience |
Manufacturer |
1 |
|
|
Food and Bakery |
1 |
More than 15 years |
10 |
Retailer |
4 |
|
Beverage |
2 |
More than 10 years |
9 |
Manufacture – Retail |
2 |
|
Dairy |
5 |
More than 20 years |
3 |
||
|
Medicinal Herbs |
1 |
More than 5 years |
6 |
||
|
Fast Food |
2 |
More than 25 years |
2 |
||
|
Dairy and Cheese |
3 |
||||
4.3.1Conducting interviews
The interviews were conducted in person to over a period of 15 months from May 2015 to August 2016. Interview times ranged from 90 minutes to 120 minutes, depending on the interviewee’s schedule and availability. Ethical issues have been considered as stated earlier through gaining informed consent and making confirming that the interview data will be treated as confidential to be used only for research purpose. Thus, a permission of audio recording the interviews was asked for in the beginning of the interview. The audio files were highly useful to help transcribe all interviews word-for-word in order to reduce the biasness and increase the reliability and validity of the research by obtaining confirmation for each transcription from respective interview participant. Moreover, this was because taking notes during the interviews might cause the researcher to lose focus of important data. Additionally, notes taking consume time due to interview time limitation.
The researcher started the interview by introducing himself and giving an overall brief about the research conducted. Then, respondents were free to express themselves on any question asked. The interview template consists of nine sections (See Appendix 1). It starts with general questions asking about the company and the interviewee, then general specific SC questions are asked to know an overview of how the network looks like. Then, the researcher gets more specific sections to ask about the four main SC functions; purchasing, warehousing, planning, and logistics. The last three sections are concerned about the risks that the company faces, and a section asking about the risks facing the entire SC, and a final section questions regarding the SC resilience awareness, SC capabilities and resilience KPIs. After each question, the researcher confirmed with the interviewees about the meaning of their answers to make sure that the answers are well understood. Moreover, asking open-ended questions gave the interviewees to incorporate more data, themes, and attitudes towards some issues that may be useful while analysing the data collected. However, the intention of the interview questions was not just to confirm the important factors in the literature but rather to discover other new factors to be able to refine the 2PM-SCR conceptual framework pre-developed earlier.
4.4Data analysis process
Qualitative data analysis consists of identifying, coding, and categorizing patterns or themes found in the data. The analytical skills of the researcher highly affects the clarity and relevance of the findings. Consequently, these skills would be either a great strength or weakness of any qualitative based research. However, it is crucial that the researcher reports and documents the analytic processes and procedures fully and truthfully so that others can evaluate the credibility of the researcher and their findings (Braun and Clarke, 2006). The Qualitative analysis process as proposed by Creswell (2009) starts by data collection and management, then the raw data are organized to be coded and described, after that comes the stage of conceptualization, classifying, categorizing, and identifying themes to be connected and interrelated together. At last, it is the interpretation process by creating explanatory accounts that provide meanings to the identified themes. The data collected through semi-structured interviews were qualitative data of participants’ opinions and ideas on the subject being discussed. Each interview audio file was transcribed word- for-word in order to avoid missing any element from the responses given by the interview participant. The analysis of the data started with some prior knowledge, initial analytic interests and thoughts. The transcription process was also an excellent way for the researcher to begin the process of familiarizing themselves with the interview data and creating meanings from them. According to Bird (2005), transcription is a key phase of data analysis within an interpretative qualitative methodology. The majority of the recorded interviews were first translated from Arabic into English and then transcribed. Therefore, during this stage, I had the opportunity to immerse myself in the collected data to the extent that he was familiar with the depth and breadth of the content. Afterwards, transcripts were carefully edited to clean them from irrelevant phrases which were not relevant to the interview topic.
A combination of two qualitative data analysis methods have been used (see Figure 4.1) to analyse the cleaned transcripts: thematic analysis (Tharenou et al., 2007; King and Horrocks, 2010) and comparative analysis (Miles and Huberman, 1994; Dawson, 2002). The thematic analysis has been used to allow new SC resilience themes (i.e. capabilities, KPIs and risks in this case) to emerge by coding openly and to confirm existing themes from the transcripts and documents, whilst comparative analysis method has been used to examine the set of themes across the 30 companies to detect the strength of evidence from empirical data (Dawson, 2002; Tharenou et al., 2007). The coding step comprised 3 key activities: identifying and confirming the themes of what, how, why and with-what for the risks, capabilities, and KPIs based on the frequency of occurrence of empirical data support from the 30 companies. Then the categories were derived and the findings were associated to relevant categories/topics in order to increase the understanding of integrative work on SC resilience. Finally, the initial conceptual framework was refined, by integrating and summarizing the empirical findings. Since there was a high volume of interview data, NVIVO software was used in this research because it has various advantages, such as reducing the manual tasks and giving more time to discover tendencies, recognize themes and derive conclusions (Wong, 2008).
Figure 4.1: Qualitative Data Analysis steps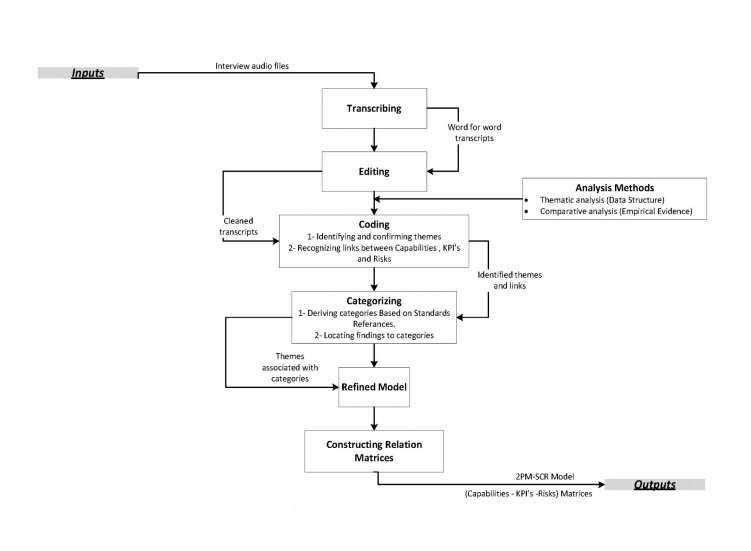
4.7.1Integrating thematic and comparative analysis methods
Thematic analysis and comparative analysis were used in order to analyse qualitative data collected through semi-structured interviews with SC managers from the 30 FMCG Companies. The themes were identified through coded data and categorized using thematic analysis.
Therefore, thematic analysis should be seen as a foundational approach for qualitative analysis and can be defined as an approach that is used for identifying, extracting, analyzing and reporting patterns (themes) within the collected textual materials and then organizing and describing those themes in detail (Braun & Clarke 2006).
The step of generating the initial codes started when the researcher had become familiar with the data through the generation of an initial list of ideas about what was in the data and what was interesting about them. The QSR NVIVO was used to perform the second step of the data analysis. This was done by grouping and naming selections from the text within each data item. As suggested by Braun and Clarke (2006), the researcher coded as many potential themes and patterns as possible as it is never possible to know what might become of interest later on. The result of this step was a long list of the different codes that the researcher had identified across the data. In searching for themes, there was a need to re-focus the analysis at a broader level than had been undertaken with the codes. This required sorting and organizing all the different relevant codes into potential themes. This step ended when a collection of possible themes and sub-themes was generated, together with related codes. A thematic map was then refined to consider whether the collated codes for each theme appeared to form a coherent pattern, whether the individual theme was valid in relation to the entire data set, and if the thematic map accurately reflected the meanings evident in the data set as a whole (Braun & Clarke 2006). After the step of searching for themes, the researcher came up with a set of themes.
Throughout the analysis, the researcher identified a number of themes following the three phases underlined by King and Horrocks (2010):
[1] Descriptive coding (first-order codes): the researcher classifies the transcribed data from the interviews that allocates descriptive codes and help in answering the research questions.
[2] Interpretative coding (second-order themes): The descriptive codes allocated which seems to carry common meaning are grouped allocated are grouped and an interpretive code is created.
[3] Defining overarching themes (aggregate dimensions): Overarching themes that can describe the main concepts in the analysis are identified.
In application to this research, the second-order themes were identified using first-order codes, and they were categorized as aggregated dimensions to reveal the main categories of risks, capabilities, and KPIs.
The comparative analysis is closely connected to thematic analysis (Dawson, 2002) and used with thematic analysis in this research. Using this method, data from different companies is compared and contrasted and the analysis continues until finding got saturated from the data collected. Comparative and thematic analyses are frequently used together within the same research data analysis, through moving backwards and forwards between transcripts, memos, notes and the literature in order to confirm the themes emerged through thematic analysis (Dawson, 2002; King and Horrocks, 2010).
Comparative analysis was used to confirm the second-order themes discovered in the empirical findings for the three main SC constructs (risks, capabilities, and KPIs) to identify the similarities, agreements, and dis-agreements across the 30 companies interviewed. Consistent with the scaling structure adopted by Rihoux and Ragin (2008) shown in Table 4.2, the second-order themes are counted based on how frequently is referred to in the empirical data. Triple ticks (√√√) represent strong evidence, double ticks (√√) represent average evidence, single tick (√) represents weak evidence, and no ticks represent no evidence supported.
Table 4.2: Scales used for comparative analysis
|
Scale |
Symbol |
Frequency ofoccurrence |
|
No evidence |
[blank] |
Zero |
|
Weak evidence |
✓ |
Between 1 and 4 (1≤x≤4) |
|
Average evidence |
✓✓ |
Between 5 and 8 (5≤x≤8) |
|
Strong evidence |
✓✓✓ |
More than or equal 9 (9≤x) |
Source: Rihoux and Ragin (2008)
Empirical findings that have been presented in narrative discussion above, will be analysed with existing studies. The purpose of this analysis is to examine whether evidences confirm, unconfirmed or existing studies.
comparative analysis used
particularly to confirm the discovery of knowledge determinates and knowledge flows
(in the knowledge network model) revealed through thematic analysis.
4.8Empirical findings from stage one
The most common way of writing up the thematic
analysis is to describe and discuss each overarching theme in turn, stating examples
from the data and using quotes to facilitate theme characterisation.Braun and Clarke
(2006) argue that the aim of compiling the thematic analysis is not merely a descriptive
summary of the content of the theme, but rather building a narrative that informs the
reader how research findings have cast light upon the issue in hand. Moreover, Symon
and Cassell (2012) highlighted that whatever approach is selected, the use of direct
quotes from the participants is necessary. These quotes should normally include both
short quotes to aid the understanding of specific points of interpretation and more
extensive passages would provide readers a flavour of the original texts.