Genetic Variability of Grasshopper Populations
4.1. Introduction
Genetic change in natural populations is one of the most subtle effects of anthropogenic toxicants in the environment, with potentially severe long-term consequences. During the last three decades, researchers have started to explore the relationship between genetics and ecotoxicology, and its role in risk assessment, due to the introduction of techniques that can reveal genetic variations on the DNA level (Berry et al. 1992; van Straalen and Timmermans 2002). The discovery that PCR with a single primer of an arbitrary sequence can be used to amplify several DNA fragments with different sizes in any genome facilitated the development of genetic markers (Williams 1990; Welsh and McClelland 1990), which has been extensively utilized to detect polymorphism in several organisms, including grasshoppers within the family Acrididae (Chapco et al. 1992; Silveira et al. 1998; Silva et al. 2002; Zhang and Kang 2005) and the family Tetrigidae (Grzywacz et al. 2012). The random amplified polymorphic DNA (RAPD) technique has become very popular because it permits easy production of many polymorphic loci using very small amounts of DNA, independently of any previous information of template DNA (Mori et al. 1999). Moreover, the use of RAPD markers is an efficient tool to differentiate geographically and genetically isolated populations belonging to the same species. It can be used to explain the presence of populations that have arisen either through genetic drift or as a result of genetic selection under different environmental conditions (Fuchs et al. 1998).
Aiolopus thalassinus (Fabr.) is one of the predominant grasshoppers in Egypt, and is widely distributed in Palaearctic, Afrotropical, Oriental, and Australian regions (Mückstein and Vlk 2015). It plays an important role in the energy flow within the agricultural ecosystem because both nymphs and adults occur throughout the year, feed on plants, and provide nourishment for many species of predacious arthropods, reptiles, mammals, and birds (Schmidt 1986). The present study is a continuation of our research on heavy metal accumulation in A. thalassinus along a pollution gradient in an industrial area. In the light of site-dependent accumulation of heavy metals and their biomagnification patterns, this grasshopper is an ecological bioindicator of Cd, Pb, Cu, and Zn pollution (unpublished data). Since populations of A. thalassinus are stable in contaminated sites, the insects seem to tolerate heavy metal toxicity by the development of efficient detoxification mechanisms and other adaptations for life in a polluted environment; however, the genetic variations at the molecular level in these insects are unknown. So, in addition to the study of pollution impact at the population level, we examined the genetic diversity of A. thalassinus populations at heavy metal-polluted and unpolluted locations, at different geographical distances. Finally, this study is the first report on the use of a DNA marker for the analysis of the genetic variability of A. thalassinus populations and to estimate the correlation between genetic diversity and heavy metal pollution, as well as between genetic similarities and geographical distances.
4.2. Materials and Methods
4.2.1. Sampling sites
Aiolopus thalassinus (Fabr.) were collected from six metapopulations at sites with different degrees of heavy metal contamination: three were selected from the Greater Cairo region (Al-Tebbin, El-Gabal, and Abou Katada) and three from different Egyptian governorates, namely Al-Beheira, Ismailiya and Dakahlia, where Wadi El-Natroon, Serapium, and El-Manzala populations are located, respectively (Fig. 4.1). The Greater Cairo region occupies 928 km2 of central Egypt, located adjacent to the Nile River. The region is spatially distributed over three governorates: Cairo, Giza and Qaliubiah (El Araby 2002).
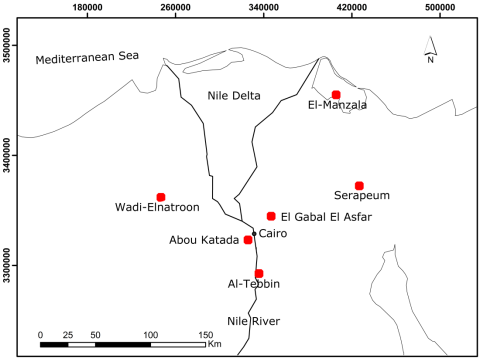
Fig. 4.1 Map of Egypt showing the sites where populations were collected
4.2.2. Collection and preparation of samples
Both males and females of A. thalassinus were collected from agroecosystems during the summer of 2012 and 2013 using insect nets, transported alive to the laboratory at the Department of Entomology, Faculty of Science, Cairo University and stored at −20℃ prior to trace metals analysis and DNA extraction. For each site, soil samples were collected randomly from the upper soil layer (0-15 cm), thoroughly mixed, and placed in plastic bags. Insect and homogenized soil samples were dried at 70 °C to a constant mass, ground into fine powder and preserved in polyethylene bags at room temperature.
4.2.3. Trace metals analysis
Digestion of soil and insect tissues was done using the same methodology described before (see page 6 & 25).
4.2.4. DNA extraction and RAPD ampliï¬cation
Genomic pooled DNA was extracted from the legs of 9 to 20 individuals of each population or subpopulation using a QIAamp DNA mini kit (Qiagen, Hilden, Germany) following the instructions of the manufacturer. A set of 20 RAPD primers (Operon Technologies Inc., Alameda, California) belonging to series B, C, D, E, H, F, J, K, L, N and AB were initially tested for studying genetic variation (Table 4.1). RAPD assays were performed using GoTaq Flexi DNA polymerase kit (promega). A total of 25 µL reaction mixture contained 50 ng of genomic DNA, 5x Green Buffer, 0.75 mM of MgCl2, 1.25 U of polymerase enzyme, 30 pmol primer and 0.5 mM of deoxynucleotide triphosphates (dNTPs). DNA amplification reactions were performed using ABI 9700 PCR thermocycler, reaction mixtures were initially incubated at 94°C for 4 min followed by 40 cycles of amplification (94°C for 45 s, 36°C for 1 min and 72°C for 2 min) followed by final extension at 72°C for 7 min. The ampliï¬ed products and a DNA molecular marker (M= 100 bp DNA ladder; Promega) were evaluated by electrophoresis on a 1.5% agarose gel, and were visualized by GelRed stain (Biotium) and UV transillumination. Gel images were digitally captured using a gel documentation system (BioRad; Gel Doc XR+).
Table 4.1 Primers used for PCR amplification of A. thalassinus populations
|
Primer |
Sequence (5′ to 3′) |
Number of bands |
Size range of bands (bp) |
|
OP B-09 |
TGGGGGACTC |
0 |
0 |
|
OP C-10 |
TGTCTGGGTG |
0 |
0 |
|
OP C-17 |
TTCCCCCCAG |
0 |
0 |
|
OP D-08 |
GTGTGCCCCA |
9 |
942-326.92 |
|
OP D-17 |
TTTCCCACGG |
0 |
0 |
|
OP N-02 |
ACCAGGGGCA |
23 |
1575-236.48 |
|
OP N-17 |
CATTGGGGAG |
0 |
0 |
|
OP N-20 |
GGTGCTCCGT |
0 |
0 |
|
OP E-03 |
CCAGATGCAC |
0 |
0 |
|
OP E-13 |
CCCGATTCGG |
0 |
0 |
|
OPAB-12 |
CCTGTACCGA |
0 |
0 |
|
OP F-13 |
GGCTGCAGAA |
0 |
0 |
|
OP H-08 |
GAAACACCCC |
20 |
1459-189.71 |
|
OP J-11 |
ACTCCTGCGA |
17 |
2111-430.63 |
|
OP J-15 |
TGTAGCAGGG |
0 |
0 |
|
OP K-11 |
AATGCCCCAG |
0 |
0 |
|
OP K-13 |
GGTTGTACCC |
0 |
0 |
|
OP L-03 |
CCAGCAGCTT |
0 |
0 |
|
OP L-08 |
AGCAGGTGGA |
0 |
0 |
|
OP L-10 |
TGGGAGATGG |
0 |
0 |
4.2.5. Data analysis
Each fragment amplified using RAPD primers was treated as a binary unit character and scored “1” for the presence and “0” for the absence. In order to measure the informativeness of the primers, the discriminatory power percent was calculated as the number of uncommon bands for each primer/ the number of uncommon bands of all primers (Grundman et al. 1995). Shannon and Simpson genetic diversity indices were calculated for the ampliï¬ed nucleotide fragments of each population in the four primers (OP N-02, OP H-08, OP J-11 and OP D-08) using the software BioNumerics version 7.5.
Shannon diversity index Hs was calculated as:

and Simpson diversity index D was calculated as:
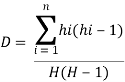
Where n is the total numbers of bands in the population, hi the intensity of the individual band i and H the total intensity of all bands in the population. The same software was used to calculate Jaccard’s coefficient of similarity based on the presence and absence of ampliï¬ed DNA fragments by the primer OP N-02, and a dendrogram for all populations and subpopulations was constructed by using the unweighted pair group method of arithmetic mean (UPGMA). To analyze the partition of total genetic variation at two hierarchical levels (population and subpopulation), analysis of molecular variance (AMOVA) was performed with the program Arlequin version 3.5 (Excoffier et al. 2005). Principal component analysis (PCA) for all populations and subpopulations was performed by SPSS version 17.0 (SPSS Statistics 2008). Finally, the Spearman rank-order correlation coefficient test was used to establish if there were relationships between heavy metal pollution and the Shannon genetic diversity index and between geographical distances and Jaccard similarity coefficients (SPSS Statistics 2008).
4.3. Results and Discussion
4.3.1. Trace metal accumulation
Table 4.2 shows that the concentrations of heavy metals in grasshopper tissues were generally lower than those in the soil, except for Cu and Zn at most sites. However, significant differences in metal contents between the six locations were indicated for both soils and tissues (H = 12.485 to 15.690, p<0.05 for soil; H = 12.789 to 15.418, p<0.05 for tissues). The metal contents in soil and grasshopper tissues from Al-Tebbin and El-Gabal Al-Asfar in Greater Cairo were higher than elsewhere for most of the studied elements, particularly in Al-Tebbin, and those from locations outside Cairo (Wadi El-Natroon, Serapium, and El-Manzala) were comparatively lower, particularly in Wadi El-Natroon. Exposure to trace metal contamination in the polluted localities is well documented. Al-Tebbin is located in the industrial district south of Cairo (Fig. 4.1). The main industrial activities include ferrous and nonferrous metallurgical work and the manufacture of chemicals, and cement (Melegy et al. 2010). Since 1923, El-Gabal Al-Asfar has been irrigated with primary treated or raw sewage and industrial wastewater effluent through a network system of open drains, which cover the entire area (Gemail 2012). The most serious threat is the accumulation of heavy metals in the soil of these locations.
4.3.2. RAPD-PCR analysis of the A. thalassinus populations
Twenty selected primers were used to examine the level of polymorphism detectable in the fourteen populations of A. thalassinus. Clear amplification was produced by only 4 primers, while 16 primers produced no amplification at all. Thus, all populations were examined using four primers: OP N-02, OP H-08, OP J-11, and OP D-08 (Fig. 4.2). Ampliï¬cation with each primer was carried out in two replicates, and only the bright, reproducible bands were scored for data analysis. RAPD-PCR products with these four primers produced a total of 69 scorable polymorphic bands in the molecular weight range of 190-2111 bp, with an average of 17 bands per primer that would be able to differentiate between populations (Table 4.1). The highest number of bands (23) was obtained with primer OP N-02, while the lowest number (9) was obtained with primer OP D-08. Primer OP J-11 produced the largest molecular weight band of 2111 bp, while primer OP H-08 produced the smallest molecular weight band of 189.71
Table 4.2 Metal contents in soils and grasshoppers of the six locations
|
Sites |
Metals |
|||||||
|
Cd |
Pb |
Cu |
Zn |
Ni |
Cr |
Fe |
||
|
Katada |
S |
0.50±0.23a |
16.6±2.3ae |
49.4±5.2ae |
84.9±2.4a |
39.0±4.1a |
41.7±7.6ab |
51.3±2.3a |
|
T |
0.3±0.03A |
0.53±0.12A |
72.0±5.0A |
296.0±7.7A |
2.4±0.15A |
1.0±0.17A |
0.25±0.006A |
|
|
Al-Tebbin |
S |
41.3±14.3b |
107.7±26.6b |
200.6±51.1b |
506.6±62.4b |
71.0±6.2b |
61.9±20.4ab |
42.7±8.1ac |
|
T |
13.7±3.6B |
22.6±5.2B |
123.2±17.1B |
279.0±66.4AC |
7.4±0.61B |
2.0±0.39B |
0.34±0.15AB |
|
|
El-Gabal |
S |
7.4±1.6c |
45.5±14.6a |
123.6±38.5ab |
148.3±15.6c |
29.3±3.5a |
58.4±6.8a |
8.4±3.8bd |
|
T |
1.7±0.67C |
6.1±2.9C |
48.7±6.3CD |
284.4±11.7AD |
5.6±1.1B |
5.5±1.4C |
0.23±0.05AC |
|
|
El-Natroon |
S |
0.43±0.05a |
4.0±0.75c |
33.6±2.9c |
38.0±4.3d |
9.0±0.80c |
27.0±2.6b |
4.2±0.86b |
|
T |
0.25±0.10AC |
0.42±0.05D |
38.6±5.4D |
67.8±9.7B |
1.0±0.24C |
6.9±1.5C |
0.36±0.03B |
|
|
Serapium |
S |
2.1±0.13d |
11.8±1.8e |
40.5±1.6ce |
73.0±3.1e |
17.0±2.6d |
35.7±0.92b |
12.2±1.5d |
|
T |
0.016±0.008D |
2.3±0.40CE |
72.2±8.3AC |
183.5±17.8C |
1.0±0.05C |
2.3±0.69AB |
0.57±0.04D |
|
|
El-Manzala |
S |
1.5±0.95ad |
2.8±0.60c |
50.4±11.8ce |
75.1±13.0ae |
42.2±8.1a |
55.7±10.1a |
30.7±7.3c |
|
T |
0.011±0.006E |
1.0±0.56ADE |
71.0±6.7AC |
208.9±35.6CD |
1.2±0.51C |
2.8±0.70BC |
0.16±0.02C |
|
Data are presented as mean ± SE in mg/kg dry weight and mg/g in case of Fe.
Different uppercase small letters within each column denote significant differences of metal concentrations in soils (S) between the six locations (Mann-Whitney U test, P ≤ 0.05).
Different uppercase capital letters within each column denote significant differences of metal concentrations in grasshopper tissues (T) between the different sites (Mann-Whitney U test, P ≤ 0.05).
 bp. Different primers showed the same variation in their ability to detect polymorphism (100%). The discriminatory powers of the OP N-02, OP H-08, OP J-11, and OP D-08 primers were 33.3, 28.9, 24.6, and 13.0%, respectively. Of the four primers tested, primer OP N-02, was more informative and yielded 23 polymorphic bands and hence was used for the comparative analysis of A. thalassinus populations. The results showed that band patterns were different for each population.
Fig. 4.2 RAPD-PCR ampliï¬cation patterns produced by the OP N-02, OP H-08, OP J-11 and OP D-08 primers with DNA from 14 A. thalassinus populations and subpopulations, collected from six different locations: Abou Katada (K1, K2 and K3), Al-Tebbin (T1, T2 and T3), El-Gabal Al-Asfar (G1, G2 and G3), Wadi El-Natroon (N1, N2 and N3), Serapium (S) and El-Manzala (E). Each population represents pooled DNA sample from 9 to 20 individuals
4.3.3. Genetic diversity and differentiation of A. thalassinus populations
The range of possible effects of toxicants on genetic variation in natural populations is diverse (van Straalen and Timmermans 2002); it has been reported that populations exposed to heavy metal pollution may either increase or decrease their genetic variation. For example, individuals of the orthopteran species Tetrix tenuicornis, collected from metal-polluted areas in Boleslaw, Poland, have reduced genetic variability in contrast to other populations located in unpolluted areas (Grzywacz et al. 2012). In our study, the diversity indices of Shannon and Simpson showed that heavy metal-polluted sites (Al-Tebbin, El-Gabal) had lower genetic diversity than that of the control sites, except for Wadi El-Natroon (Fig. 4.3), and the populations from Abou Katada had the highest value of genetic diversity. However, among all the metals analyzed in both soil and A. thalassinus, only the Fe contents of soil showed a positive significant correlation with the genetic diversity of populations (rs = 0.829, df = 5, p<0.05) (Fig. 4.4 & 4.5). A decrease of genetic variability may occur as a result of selection for toxicant resistance and may be affected by other factors. On the other hand, it is also known that heavy metals have mutagenic effects on DNA, which may increase genetic variability (Theodorakis and Shugart 1998).

Fig. 4.3 Mean genetic diversity indices of A. thalassinus populations from polluted and unpolluted sites
Based on RAPD markers, a UPGMA dendrogram was drawn using Jaccard’s similarity coefficient to visualize the relationships among A. thalassinus populations (Fig. 4.6). Six populations formed five big branches, largely corresponding to their geographical distributional regions: in Al-Tebbin, Abou Katada, El-Gabal, Wadi El-Natroon, Serapium, and El-Manzala. The gene flow between A. thalassinus populations was then investigated by analysis of the population genetic structures. AMOVA analysis showed that the genetic variation among populations (75.7%) was larger than between subpopulations (24.3%), indicating that populations within regions had less genetic differentiation than those between regions (Table 4.3). Migration played an important role in gene flow and genetic diversity for the geographical populations. Therefore, in our study, the comparatively high genetic variance among populations could be explained in terms of absent or short-distance migrations of A. thalassinus. Our results were similar to those for the grasshopper Melanoplus femurrubrum(Chapco et al. 1992), in which the degree of genetic variability between populations was slightly greater than that within populations, but were contrary to the results for the grasshopper Locusta migratoria(Zhang and Kang 2005), which might result from the migrating nature of the locust. Also, migration resulted in unrestricted gene flow between populations of the moth Scirpophaga incertulas, as nearly all populations were clustered as one group with genetic distance values in the range of 6-22%, suggesting that gene flow between populations is independent of geographic distance (Kumar et al. 2001).
Geographical isolation is one of the important factors associated with population differentiation; the greater the geographical distance between populations, the less chance of gene flow; thus, there should be more differentiation between them (Zhang and Kang 2005). However, in our study, clustering analysis separated the six regional populations into two main clusters: The first cluster included the populations from Greater Cairo (Al-Tebbin, El-Gabal, and Abou Katada), and the second one contained the populations located outside Cairo (Wadi El-Natroon, Serapium, and El-Manzala) (Fig. 4.6). In spite of the narrow geographical range, all Cairo populations were differentiated from each other, revealing restricted gene flow between them. In addition, the populations of Wadi El-Natroon and Serapium, which are located comparatively distant from each other and close to Cairo populations (Fig. 4.1), were clustered together with the northern population of El-Manzala in the UPGMA dendrogram. This suggests that besides geographical distances, local conditions have a high impact on the A. thalassinus population structure and may strongly influence gene flow between sites, even on a very small scale. Changes in genetic variability may also be a consequence of adaptation to a contaminated environment and exposure to genotoxic chemical pollutants (Bickham and Smolen, 1994; Enan, 2006). Mutations that inhibit primer binding or otherwise interfere with ampliï¬cation can reflect this variation using the RAPD technique (Nelson et al. 1996), and by an assessment of DNA polymorphism, it is possible to detect population genetic responses to toxicant exposure (Grzywacz et al. 2012). According to the World Health Organization (WHO 2006), Cairo is considered one of the cities with the highest levels of air pollution worldwide, and based on studies conducted by the national environmental board, the measured annual average of the air quality index of Cairo exceeds the maximum acceptable tolerance level by a factor of three (UNCSD 1997). Thus, some fraction of the observed genetic variation can also be explained in terms of the selection pressure imposed on A. thalassinus populations by environmental pollutants in Cairo. Principal component analysis (PCA) supported the division of populations based on the cluster analysis (Fig. 4.7); the results exhibited apparent differences between populations inside and outside Cairo. Furthermore, the population of Al-Tebbin, which is considered one of the biggest industrial zones in Egypt, could be distinguished from the other two populations inside Cairo.
 Fig. 4.4 Correlation between Shannon index of A. thalassinus populations’ genetic diversity and metal contents in soils of the six locations. For each metal the value of Spearman rank-order correlation coefï¬cient test (rs), degrees of freedom (df) and probability (p) are given
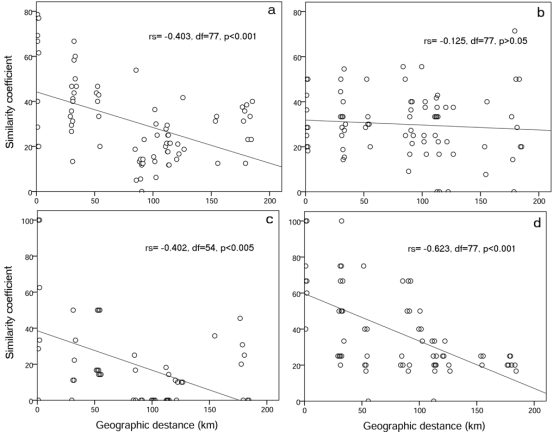
Based on our RAPD analysis, gene flows among the three populations outside Greater Cairo have apparently occurred. Meanwhile, limited gene flows might exist among the populations of Greater Cairo. To test for a geographically based distribution of genetic diversity, we carried out Spearman’s rank correlation between genetic similarities and geographical distances. The results showed a moderate level of correlation for three of the four primers (rs = -0.403, p<0.001 for OP N-02; rs = -0.402, p<0.005 for OP J-11; rs = -0.623, p<0.001 for OP D-08 primer), while there was no correlation in the case of the primer OP H-08 (rs = -0.125, p>0.05) (Fig. 4.8), indicating that the population differentiation was not completely related to the degree of geographical isolation. Therefore, although we cannot exclude the influence of geographical distances, environmental pollutants seem to have a role in the reduction of genetic variability in A. thalassinus populations. Moreover, low gene flow and high population divergence suggest that genetic drift may be of great concern for this species.

Fig. 4.5 Correlation between Shannon index of A. thalassinus populations’ genetic diversity and metal contents in populations’ tissues from the six locations. For each metal the value of Spearman rank-order correlation coefï¬cient test (rs), degrees of freedom (df) and probability (p) are given

Fig. 4.6 Dendrogram showing the similarity among the populations and subpopulations of A. thalassinus, constructed with RAPD data and obtained using Jaccard coefficient using UPGMA
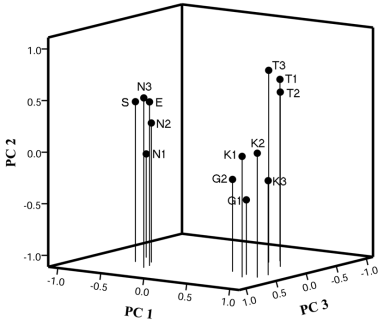
Fig. 4.7 Principal component diagram for 13 geographical populations and subpopulations of A. thalassinus: Abou Katada (K1, K2 and K3), Al-Tebbin (T1, T2 and T3), El-Gabal Al-Asfar (G1 and G2), Wadi El-Natroon (N1, N2 and N3), Serapium (S) and El-Manzala (E)
Table 4.3 AMOVA (molecular analysis of variance) results for 6 geographical populations of A. thalassinus based on RAPD markers
|
Source of variation |
df |
SSD |
Variance component |
% total variance |
P value |
|
Among populations |
5 |
44.43 |
3.17 |
75.70 |
<0.0001 |
|
Among subpopulations |
7 |
9.16 |
1.01 |
24.30 |
<0.0001 |
|
Total |
13 |
53.60 |
4.19 |
 Statistics included degrees of freedom (df), sum of squared differences (SSD), variance component estimates and percentages of total variance (% Total variance) contributed by variance component and the probability (P) of obtaining a more extreme component estimate by chance. P-value is estimated from 1023 sampling permutations.
Fig. 4.8 Relationship between Jaccard similarity coefficients of A. thalassinus populations and the geographic distances between them. (a) OP N-02 primer, (b) OP H-08 primer, (c) OP J-11 primer and (d) OP D-08 primer. For each primer the value of Spearman rank-order correlation coefï¬cient test (rs), degrees of freedom (df) and probability (p) are given
The present results give evidence that supports the validity of interpopulation determination of variability with RAPD analysis. Our data did not reveal a clear correlation between heavy metal pollution and genetic diversity, as was proposed by other authors (Ross et al. 2002; Zhiyi and Haowen 2004; Maes et al. 2005). Since many pollutants occur together in the environment, and the individual effect of each metal on genetic diversity was not noticeable, their combined and synergistic effects might exert manifold stress on these populations to different degrees. Therefore, contrary to the results of these authors, geographical distances, and environmental pollutants, in general, seem to have an influence on the genetic diversity of A. thalassinus populations. This acridid grasshopper is a good model for investigation of the impact of heavy metals on natural populations and probably can be used as a bioindicator of heavy metal pollution in ecosystems (Schmidt et al. 1992). However, on the molecular level, future studies are needed to confirm the mechanisms of decreasing polymorphism in populations living under pressure of environmental pollutants and between geographically distant populations, and to see how and to which degree such toxicants affect the genetic structure of grasshoppers.