How Spreadsheets can Solve Complex Problems
Explain how spreadsheets can be used to solve complex problems (P1)
Task 1:
Generate a report explaining how spreadsheets can be used to solve the following complex problems giving examples to support your explanation
Cash flow forecasting
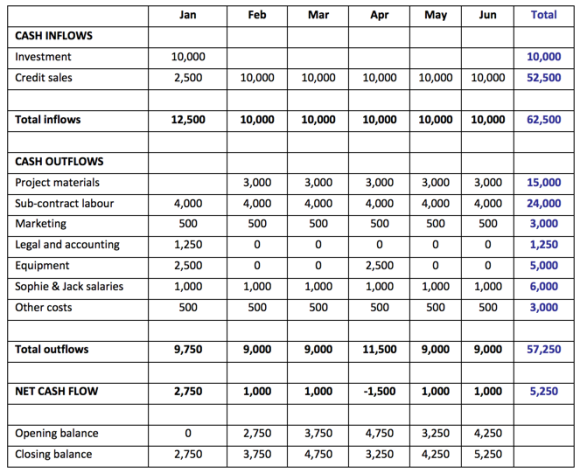
Cash flow forecasting is used to see what comes into a business and what goes out. This estimates amounts of cash that comes in and goes out during a period of time. A cash flow forecast will show what the firm is spending its money on.
 Cash flow forecasting can be used in spreadsheets as you can use formulas on it to calculate sums and there is less errors whilst using it. It saves time you can calculate things quicker on it rather than doing it one by one. You can conditional format on it which sets rules and highlights the rows you need highlighting.
This cash flow sheet shows the money coming and going out between a time. It shows money that comes in each month of the year and how much goes out for things like expenses, wages and so on. When you input data into the cells it will automatically calculate the data with the formulas in the cells.
They can then use this year’s cash flow sheet and compare it to next year’s seeing if there is any difference.
Budget control
Budgetary control is how well you utilise budgets to keep track of costs under control and operations in a certain time period. Budget control is a process for managers to put financial and performance targets in place with budgets, compare the final result, and adjust performance when it is needed. Organisations will use budget control to keep costs under control so they don’t over spend.
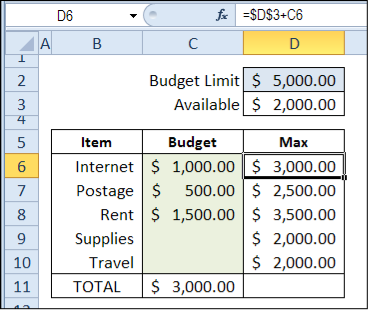
This budget control shows the budget limit which is $5,000 and they have spent $3,000 leaving them with $2,000 available. This show that they have spent $1,000 on internet, $500 on postage and $1,500 on rent. It has calculated the total and has shown how much they have left to spend.
What-if scenarios
What-if scenario is the way businesses use a planning and modelling technique to get various projections for outcomes based on selectively changing the inputs.
Scenario planning let’s a business to be prepared for dramatic situations more quickly and act effectively because they have made strategies to use.
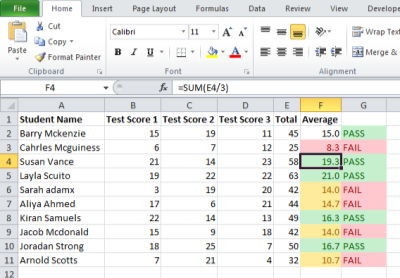
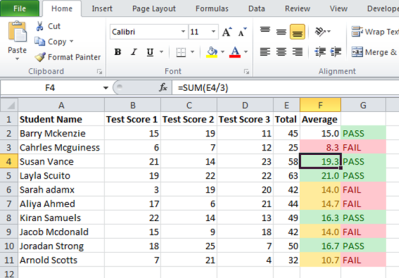
In this spreadsheet, there are 11 people who have taken the test. The people who have an average of over 15 have passed and the ones who have an average of less than 15 have failed. The people who have passed are coloured in green and the people who have failed are in red. The colours displayed are according to the what-if scenario.
Sales forecasting
Sales forecasting is the process of predicting sales in the future. An accurate sales forecast enables companies to make informed business decisions and predict short-term and long-term performance. Companies can base their forecasts on past sales data and economic trends.
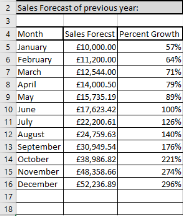
If a business is creating a sales forecast on paper they will get many errors in calculations as they have to enter the data and calculate it manually. If a business uses excel to make their sales forecasts they will find it easier as there will be less errors and it will calculate automatically without any errors.
Payroll projections
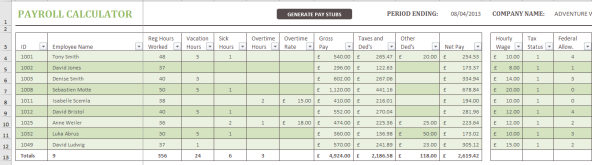 In any businesses or organisations, they will have a system which will work out the wages for the staff and this system also calculates taxes payed according their wage. In other words, it shows how much to pay workers and employees during a week, month or other period.
In this payroll projection sheet, you can see the included amounts that the business will pay its employees. This is based on the hours that they are working regularly, vacation/holidays hours, sick hours, gross pays, taxes, net pay etc. This is easy for a business to use at it will automatically adjust the wage according to the hours they work.
Statistical analysis
Statistical analysis is the collection of data, presenting large amounts of data and exploring data to find patterns and trends. They can use average, mode and median to calculate the overall figures. After the data has been collected you can present it in different formats such as graphs and tables. Once the graph has been completed you are bale to analyse it for underlying patterns and trends.
In statistical analysis, a business or an organisation can solve complex problems by entering different sorts of formulae to calculate the average, mode, median or total of a cell.
Trend analysis
 Trend analysis is an analysis that will let businesses to predict what will happen with a stock in the future. Trend analysis is based on data from the past about the stock’s performance given the overall trends and patterns of the market and certain indicators within the market. Trend analysis gives out ideas and records on past income, expenses and net cash flow of the past so they can use this to improve the production of their businesses.
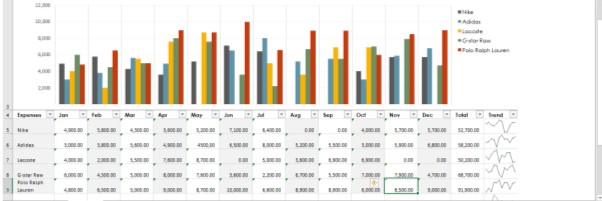
This graph show the amount of money a brand makes within a month. We can see which brand has the least and highest amounts by looking at the graph chart. By using graphs and charts it becomes more organised and shows who has made profit and who has lost money.
Discuss how organisations can use interpretation methods to analyse data (D1)
Comparisons of data
Organisations can use many interpretation methods to analyse data. They can compare data from using SUM, AVERAGE, COUNT, SUMIF, ROUND, SUBTOTAL, RAND, RATE, MIN, MAX, SYD FV etc.
Sum
The sum is a formula which will allow you to add different values from different cells. This makes it easier for you as it will allow you to add big numbers together without any errors. The calculation is done automatically. For example
= SUM (B4:B12)
=SUM (B9:B12, D4:D17)
Average
The average or arithmetic mean is the calculation of 2 or more different values. Where number 1 may contain a cell reference or range that you want as an average.
And number2 can be optional numbers that can go up to 255 max. The average normally refers to the mean value of a variety of numbers in a set that is found by adding all the numbers in the set and then dividing the answer by how many numbers there was in the set.
Count
The count function counts all the cells that contains numbers and it will put all the numbers in a list of arguments. The use of count function is to get a number field in a range of numbers. For example; we can enter a formula or function that would count the from B1:B27
=COUNT (B1:B27)
Sum IF
The use of SUMIF function is to add up the values in a range that would meet the task or criteria that you choose. For example, if you want to add/sum only the values that are larger than in a column, you can use the formula =SUMIF (C2:C25,”>5″) or you can just click on any option from conditional formatting.
Round
The round function rounds a number to an any decimal point you want. For example, if cell E2 contains 55.86987, and you want it to be rounded to two decimal places then you can use this formula =ROUND (E2.2) then your number will be rounded to 55.86.
Subtotal
A subtotal is a list or database in a spreadsheet where it only contains subtotals from cells of larger cells. Once you have created a subtotal you can then edit or modify it by using the subtotal function which is SUBTOTAL (function, ref2, [ref3],).
Trend analysis
Trend analysis is the movements and the course of a trend that can suggest not only what has happened in the past but it can also predict what will happen in the future. The objective of the trend analysis is there to answer questions by assessing changes in a collection of values of a variable. This can things such as the changes in the profit made daily for a specific product.
Businesses can use trend analysis in spreadsheets by using graph charts that would allow people to easily see the trend analysis of the business and it will be able to be understood quicker. They can also see where the business is making profit and where it is making loss.
Purpose of Trend Analysis
Business leaders can make mistakes, and these mistakes can cost them. Trend analysis is a helpful tool that leaders use to limit the risk of tactical, operational and financial tactics. This tool can let leaders make decisions linked to trends that suggest the success of one opportunity compared to another. By doing this they cause less room for error and businesses will be more successful.
Charts and Graphs:
Many businesses and organisations use different types of charts and graphs to determine whether if they are going to experience a loss or profit by adding all monthly or yearly expenses. These charts can include pie charts, line chart, brick chart, bar box and vertical bar graph etc.
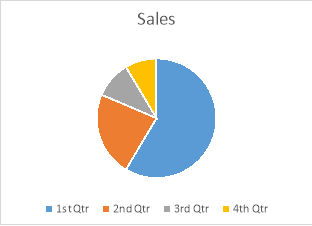
Pie Charts:

Line charts:


Series 1: Loss: 3% Profit: 4.5%
Series 2: Loss: 1.9% Profit: 3%
Series 3: Loss: N/A Profit: 5%
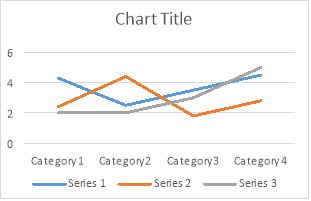
Bar box:
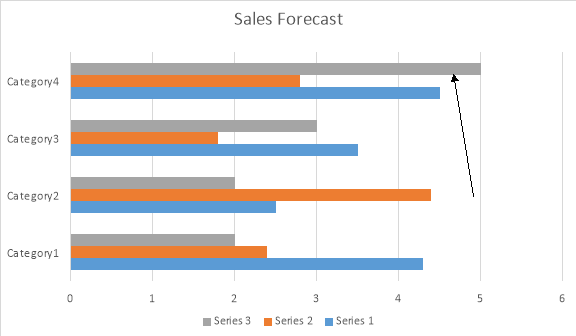
Category 1:
Series 1: 4.2%
Series 2: 2.4%
Series 3: 2%
Category 2:
Series 1:2.5%
Series 2: 4.3%
Series 3: 2%
Category 3:
Series 1: 3.5%
Series 2: 1.8%
Series 3: 3%
Category 4:
Series 1: 4.5%
Series 2: 2.8%
Series 3: 5%