Liquid Liquid Equilibrium of Pold (Ethylene Glycol)
Liquid–Liquid Equilibrium of Poly (ethylene glycol) 1500 + di-Potassium Tartrate +Water at different pH (6.41, 7.74 and 9.05)
Alireza Barani
Chemical Engineering Department,Faculty of Engineering, Shomal University, Amol, PO Box 731, Iran
Mohsen Pirdashti[1]
Chemical Engineering Department,Faculty of Engineering, Shomal University, Amol, PO Box 731, Iran
Abbas Ali Rostami
Chemical Engineering Department,Faculty of Engineering, Shomal University, Amol, PO Box 731, Iran
Abstract:
Liquid – liquid equilibrium (LLE) data have been determined for aqueous two-phase systems (ATPSs) containing (ATPS) poly (ethylene glycol) (PEG) 1500 +di potassium tartrate +water at 298.15 K and in various pH values (6.41, 7.74 and 9.05). Two physical properties (density and refractive index) were used to obtain the compositions of phase and the ends of the tie-lines. The effect of pH on the binodal curve, tie-line length and slope of tie line are discussed. The binodal curves of these systems have been correlated by Bleasdale’s equation. Furthermore, the Othmer-Tobias and Bancroft equations was used to correlate the tie line data points. Finally, the effective excluded volume (EEV) of the salt into the PEG aqueous solution were obtained.
Keywords: ATPS; Phase diagram; pH; Refractive index; Poly(ethylene glycol); di potassium tartrate
- Introduction
The dissolving of one polymer and one salt or two aqueous polymer solutions together in water results in the formation of two immiscible aqueous phases systems, called Aqueous Two-Phase Systems (ATPSs). Albertson introduced these systems in 1965 for the purpose of separating the biological materials1. Several industries can benefit from employing ATPS including biotechnology, petroleum, paint, adhesives, and pharmaceuticals 2, 3. Moreover, the ATPS is effective in providing separation technique due to its undemanding scale-up viability 4-6, economic efficiency7, 8, ease of continuous process 9, decreased interfacial tension 10, short processing time 11, low energy consumption 12, 13, good resolution 14, high yield 15, relatively high load capacity 16, and selective extraction 17. The data derived from phase diagram, composition and the physical properties of the phase formation are essential in order to optimize, design and increase the size of these processes; and develop the models that predict phase partitioning18-20. Poly Ethylene Glycol (PEG) is a water-soluble hydrophilic and biocompatible polymer employed by the studies about ATPS 21. Accordingly, Selber et al. (2004) 3 provided a useful summary of experimental liquid-liquid data and equilibrium diagrams for systems including PEG, inorganic salts and water. Peng et al.10 (1995) investigated the phase diagram and protein partition coefficient in ATPS containing PEG and K2HPO4 + KH2PO4 and found some merits in this polymer-salt system. Furthermore, several studies 22-27 have focused on the Liquid-Liquid Equilibrium (LLE) data of PEG + salt ATPSs. Zafarani-Moattar et al. (2008) indicated some advantages of using tartrate such as biodegradability and effectiveness in partitioning of biological materials through being discharged into biological waste water treatment plants 27. In the current study, the phase equilibrium data for PEG1500 +di-potassium tartrate (K2C4H4O6 ) +H2O were determined at 298.15K and three pH values (6.41 , 7.74, and 9.05). In addition, the effects of pH on the binodal curve and Tie-Line Length (TLL) and Slope of Tie Line (STL) were determined. Likewise, the calibration curves were applied as an analytical technique [MN1]with measuring the density and refractive index. Finally, Othmer-Tobias and Bancroft equations 28 were used to fit the tie- line data and Bleasdale’s equation was employed 29 to correlate the experimental LLE data from the investigated systems.
- Experimental
- Materials
To prepare the materials, PEG [HO (C2H4O) n H] with average of 1500 gmol-1 and di potassium tartrate with minimum purity of 99.5% by mass were obtained from Merck. The polymer and salts were used without further purification with the distilled deionized water.
2.2. Apparatus and Procedure.
2.2.1. Analytical Methods
The same method of calibration plots and evaluation of parameters in the literatures 30 were employed to obtain the compositions in both phases from measurements of the two physical properties (density and refractive index) at 298.15 K. in order to obtain the compositions, calibration equations were previously obtained. Homogeneous ternary mixtures with compositions from 0 to 30 wt% (total solute composition) were prepared by weight, and then density and refractive index were measured at 298.15 K. the concentration of PEG and salt were obtained using eq 1, which related the refractive index and density to the concentration of salt and PEG at 298.15 K, where  represents the mass fraction of PEG,
  is the mass fraction of di-potassium tartrate, and
  is the value of the refractive index and density of pure water at 298.15 K. Experimental data were fitted to polynomial expansions up to order 2 by least-squares (order 3 was proved unnecessary in all cases 23:
|
|
(1) |

Where Z is the physical property (density or refractive index) and  to
to  are fitting parameters. The refractive index was determined by refractive index measurements at 298.15 K using a refractometer (CETI Belgium model) with an accuracy of 0.0001
 . Then, densities was measured by using an Anton Paar oscillation U-tube densitometer (model: DMA 500) with a precision of ±10-4 g.cm-3.
2.2.2. Binodal Curve
The experimental apparatus employed is similar to the one used previously 31. A glass vessel, volume of 25 cm3 was used to carry out the equilibrium determination. It was provided with an external jacket containing water at constant temperature. The temperature was controlled to within +-0.05 K. The binodal curves were determined by the cloud-point method 32. The cloud-point method was investigated by titration method where step by step and exactly known amounts of polymer (titrant) was added to an aqueous solution salt of known concentration (or vice versa) under stirring until the solution becomes cloudy.
2.2.3. The TLL and STL
Tie lines were also determined using the equilibrium set designed by ourselves and according to previously described procedures [14]. For the determination of the tie lines, we selected 4 samples for each pH that were prepared by mixing appropriate amounts of PEG, salt, and water in the vessels. Samples were stirred for 5 min and settled for 24 h, with temperature controlling condition, to ensure that equilibrium was established. To separate the resulting phases, the tubes were centrifuged (Hermle Z206A, Germany) at 6000 rpm for 5 min. The resulted phases showed no turbidity and the top and bottom samples were easily separated. After the equilibrium was achieved, phases were with- drawn using syringes. The top phase was sampled first, with care being taken to leave a layer of material at least 0.5 cm thick above the interface. The bottom phase was remain in the glass vessel with a long needle. TLL provides an empirical measurement of the compositions of the two phases, which can be calculated by the following equation:
|
TLL= |
(2) |
Where  and
and  denote the concentration of PEG and salt in top and bottom phase, and STL is given by the ratio of the difference between the polymer and salt concentrations in the top and bottom phases as presented in Eq. 3:
|
(3) |

Where and are the polymer and salt concentrations, expressed in mass percent, respectively, and the superscripts T and B designate the top and bottom phases, respectively.
2.2.4.Binodal Curve and TLL Correlation
For the binodal data correlation, the Bleasdale’s equation [27] can be suitably used to reproduce the binodal curves of the investigated systems
|
(4) |
Where a, b, and c represent the fitting parameters and and demonstrate the polymer and salt mass fractions, respectively. The binodal data of the above expression were correlated by least-squares regression.
The reliability of the measured tie-line compositions was ascertained by Othmer-Tobias (Eq. 5) and Bancroft (Eq. 6) correlation equations
|
|
(5) |
|
|
(6) |
Where  is the mass fraction of polymer in the top phase,
  is the mass fraction of salt in the bottom phase,
  and
and  are the mass fractions of water in the bottom and top phases, respectively, and
  ,
,  ,
,  , and
, and  are the adjusted parameters.
Besides, the obtained experimental data can also adapt to the equation provided by Guan and co-workers33
|
Ln ( |
(7) |
 .WPEG/
  /
/ Where  and
and  stand for the polymer and salt molecular weight, respectively. Moreover, V* is the Effective Excluded Volume (EEV) of the salt in the PEG aqueous solution.
- Results and Discussion
- Fitting parameters of calibration equation
The values of the coefficients a, b, c, d, e and f for the system studied are shown in table 1, respectively.
|
Table 1.The value of the coefficients observed from eq. 1. |
|||||||
|
|
|
|
|
|
|
||
|
|
1.3341 |
0.0581 |
0.1302 |
-0.0718 |
0.2257 |
0.3882 |
|
|
Ï/g.cm3 |
0.9842 |
0.6783 |
0.1761 |
0.0098 |
0.1643 |
0.1018 |
|


- Binodal Curve
The binodal curve data of the PEG + di-potassium tartrate + H2O system are presented in Table 2.
|
Table 2. Binodal curve data of the PEG 1500 + di-potassium tartrate+ water system at 298.15 K and 0.1 MPa at different pH values |
|||||||
|
|
|
|
|||||
|
|
|
|
|
|
|
||
|
42.71 |
9.01 |
27.75 |
10.49 |
43.43 |
10.49 |
||
|
39.57 |
9.50 |
45.58 |
7.20 |
43.67 |
7.20 |
||
|
35.50 |
10.21 |
42.04 |
7.80 |
41.88 |
7.80 |
||
|
34.48 |
10.32 |
39.31 |
8.30 |
39.51 |
8.30 |
||
|
28.54 |
11.58 |
35.77 |
9.01 |
28.93 |
9.01 |
||
|
33.70 |
10.55 |
23.88 |
12.01 |
22.04 |
12.2 |
||
|
23.17 |
13.01 |
16.18 |
14.77 |
19.89 |
14.77 |
||
|
17.07 |
15.01 |
13.94 |
15.73 |
16.53 |
15.73 |
||
|
14.25 |
16.21 |
13.42 |
16.05 |
14.53 |
16.05 |
||
|
12.11 |
17.02 |
11.75 |
16.91 |
12.55 |
16.91 |
||
|
11.28 |
17.52 |
7.59 |
19.71 |
11.16 |
19.71 |
||
|
7.01 |
21.01 |
6.90 |
20.36 |
9.19 |
20.36 |
||
|
6.17 |
21.64 |
5.29 |
23.19 |
8.10 |
23.19 |
||
|
5.85 |
22.01 |
5.03 |
22.24 |
7.45 |
22.24 |
||
|
5.06 |
27.53 |
4.74 |
24.01 |
6.76 |
24.01 |
||
|
4.65 |
23.50 |
4.32 |
24.70 |
5.80 |
24.70 |
||
|
3.17 |
26.01 |
3.62 |
26.01 |
4.99 |
26.02 |
||
|
Standard uncertainties: u(wi) = 0.002; u(P) = 5 kPa; u(T) = 0.05 K. |
|||||||


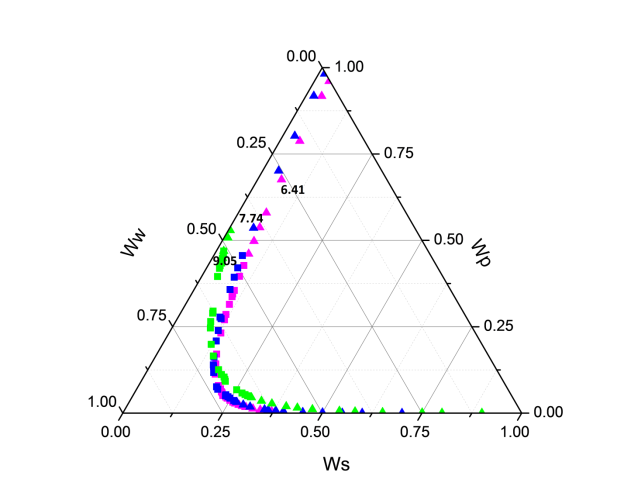
Figure 1 shows the binodal curves obtained from Bleasdale’s equation. The effect of pH is clear: very small on the size of the heterogeneous region. This trend is in agreement with the experimental results of de Oliveira [12] and Martins [15].
|
|
|
Figure 1. Phase diagram of the PEG (1500) + di-potassium tartrate + water (3) two-phase system at T = 298.15 K and various pH (6.41, 7.74 and 9.05): (â- ) experimental binodal (6.41(pink), 7.74(blue) and 9.05 (green); (â-²) calculated binodal using Bleasdale’s equation (3). |
- TLL and STL
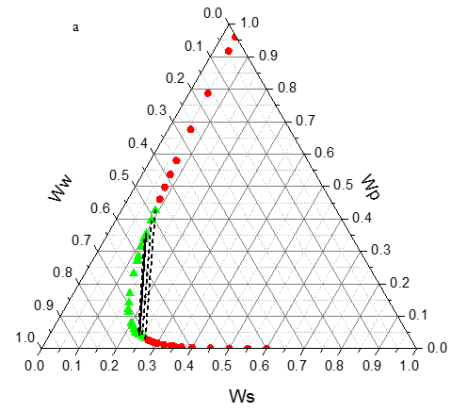
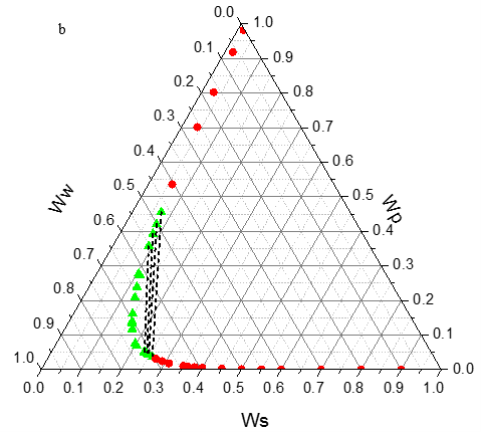
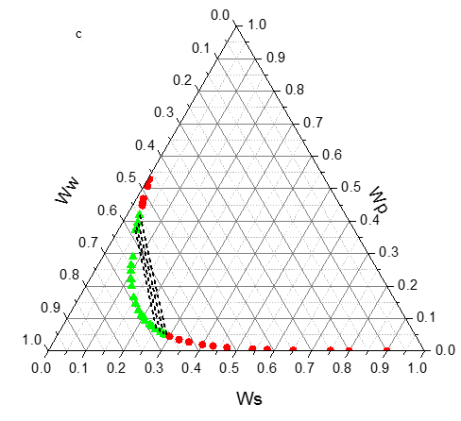
Tie line compositions are given in Table 4. Figure 2 presents the tie lines and the binodal curve together for the PEG + di-potassium tartrate + water system at 298.15 K.
|
|
|
|
|
|
|
Figure2. Phase diagram of the PEG + di-potassim tartrate + water two-phase system at T = 298.15 K and pH 6.41 (a), 7.74 (b) and 9.05 (c) : (-â-²-) experimental binodal; ; (- – -â-- – -) calculated by using eq. 4. |
|
Table 4. Phase composition, tie-line data and physical properties of PEG 1500 + di-potassium tartrate+ water aqueous two-phase system at 298.15 K and 0.1 MPa |
||||||||||||||||
|
|
Total System (%mass) |
Top phase |
Bottom phase |
|
– |
|||||||||||
|
|
|
|
|
|
|
|
|
|
|
|||||||
|
6.41 |
17 |
20 |
10.55 |
33.70 |
1.1217 |
1.3922 |
23.50 |
4.65 |
1.1620 |
1.3703 |
31.80 |
2.24 |
||||
|
17 |
21 |
10.21 |
35.50 |
1.1226 |
1.3936 |
24.01 |
4.31 |
1.1652 |
1.3705 |
34.10 |
2.26 |
|||||
|
18 |
20 |
9.50 |
39.57 |
1.1252 |
1.3965 |
25.01 |
3.70 |
1.1716 |
1.3710 |
39.07 |
2.31 |
|||||
|
18 |
21 |
9.01 |
42.65 |
1.1275 |
1.3985 |
26.01 |
3.17 |
1.1782 |
1.3717 |
42.97 |
2.32 |
|||||
|
7.74 |
17 |
20 |
9.01 |
35.77 |
1.1142 |
1.3919 |
23.15 |
5.29 |
1.1606 |
1.3710 |
33.62 |
2.14 |
||||
|
17 |
21 |
8.30 |
39.31 |
1.1157 |
1.3932 |
24.01 |
4.74 |
1.1660 |
1.3714 |
37.96 |
2.20 |
|||||
|
18 |
20 |
7.80 |
42.04 |
1.1172 |
1.3947 |
24.70 |
4.32 |
1.1705 |
1.3718 |
41.33 |
2.23 |
|||||
|
18 |
21 |
7.20 |
45.58 |
1.1195 |
1.3966 |
26.01 |
3.62 |
1.1791 |
1.3727 |
45.97 |
2.23 |
|||||
|
9.05 |
17 |
20 |
4.01 |
39.51 |
1.0844 |
1.3831 |
25.18 |
6.76 |
1.1791 |
1.3781 |
39.00 |
1.54 |
||||
|
17 |
21 |
3.30 |
41.88 |
1.0836 |
1.3835 |
27.01 |
5.80 |
1.1912 |
1.3796 |
43.17 |
1.52 |
|||||
|
18 |
20 |
3.08 |
42.66 |
1.0835 |
1.3836 |
28.01 |
5.34 |
1.1980 |
1.3806 |
44.87 |
1.49 |
|||||
|
18 |
21 |
2.80 |
43.67 |
1.0833 |
1.3838 |
28.80 |
4.99 |
1.2034 |
1.3814 |
46.59 |
1.48 |
|||||


–
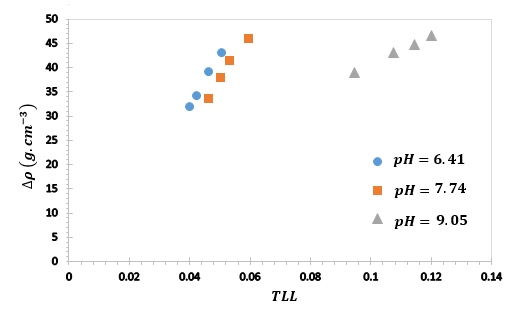
The tie lines are determined by connecting each corresponding set of total, top, and bottom phase compositions. The coexisting phases are close in composition. A mass balance check was made between the initial mass of each component and the amounts in the bottom and top phases on the basis of equilibrium compositions. The mass of each phase was calculated from volume and density measurements. The relative error in the mass balance was less than < 2%. The densities of the bottom phases were close to 1.2 g/cm3 while those of the top phases ranged from 1.08 to 1.12 g/cm3. The density difference between the phases (ΔÏ), increase with an increase in the TLL and slightly decrease with an increase in pH. From Figures 7, it is observed that the density differences between the phases show linear relationship with TLL. A comparable conduct was likewise depicted 31, 34, 35.
|
|
|
Figure *. Relationship between density difference (ΔÏ) and tie line length (TLL) for the PEG 1500 + di-potassium tartrate + water at different pH values. |
3.4. Binodal curve and tie-line data correlation
The coefficients of equation 4, along with the corresponding standard deviations of the investigated systems are given in Table 3.
|
Table 3. Values of parameters of equation 4 for PEG 1500 + di-potassium tartrate + water at different pH values |
||||
|
|
|
|
|
|
|
6.41 |
1.00626 |
0.000180 |
0.000258 |
0.9946 |
|
7.74 |
0.99992 |
0.000002 |
0.000016 |
0.9929 |
|
9.05 |
0.99956 |
0.000009 |
0.000108 |
0.9980 |


On the basis of obtained standard deviation, we conclude that equation 4 can be satisfactorily used to correlate the binodal curves of the investigated systems. The figures of the binodal curves can show the reliability of the model.
Also, the linear dependence of plots of log((1 – wt1)/wt1) against log((1 – wb2)/wb2) and log(wb3/wb2) against log(wt3/wt1) indicates an acceptable consistency of the results. The corresponding correlation coefficient values, R1 and R2, are also given in Table 5.
|
Table5. Values of the parameters of Eqs. 5, 6 and 2 for PEG + di-potassium tartrate + water at different pH values. |
||||||
|
|
|
|
|
|
|
|
|
6.41 |
0.0627 |
2.9183 |
0.9972 |
0.1067 |
1.2333 |
0.9970 |
|
7.74 |
0.7425 |
1.4278 |
0.9996 |
2.6953 |
0.3141 |
0.9998 |
|
9.05 |
0.5605 |
0.9200 |
0.9929 |
1.8809 |
1.0791 |
0.9931 |


Moreover, V* is the Effective Excluded Volume (EEV) of the salt int the PEG aqueous solution. As indicated in Table 7, a nonlinear regression was used to obtain the EEV values. Although the performance of this model is worse than Bleasdale, it has a stronger theoretical background (statistical geometry), which enables the evaluation of the salting-out effect in the different used salts. However, it should be noted that both models have been successfully adopted for the correlation of binodal data from polymer/polymer and polymer/salt ATPs 36, 37
To correlate the liquid-liquid equilibrium data, a simple two parameter equation based on the the binodal theory (Guan and co-workers 33) was employed:
|
Ln( |
(8) |
|
 /
/ ) = β + k. (
 –
– )
)In this equation b and k are ï¬tting parameters that can be regarded as “effective” virial (or activity) coefï¬cients and the salting-out coefï¬cient of the salt. Wi is the mass fractions of PEG and salt, and the superscripts in the equation indicate the top and bottom (bot) phases. The linear regression was used to find the values for b and k (Table 6).
|
Table 6. Fitting parameter for equation(8) and statistic of regression |
||||
|
pH |
K |
Î’ |
|
|
|
6.41 |
4.0697 |
-1.3560 |
0.9949 |
|
|
7.74 |
4.9285 |
-1.6670 |
0.9947 |
|
|
9.05 |
8.4869 |
-3.2854 |
0.9952 |
|

|
Table 7. Effective excluded volume parameter correlation |
|||
|
pH |
EEV |
|
|
|
6.41 |
247.11 |
0.9952 |
|
|
7.74 |
283.76 |
0.9605 |
|
|
9.05 |
309.06 |
0.9773 |
|

- Conclusions
New LLE data and tie line compositionstie for the systems PEG 1500 + di-potassium tartrate + water at 298.15 K, were meauserd at various pH(6.41,7.74 and 9.05). An increase in pH promotes an increase in the slope of the tie-line (STL) and also increase length of tie line. The heterogeneous region for each system increases with pH. This means that changing the pH affects the equilibrium compositions of the equilibrium phases: increases the polymer content in the top phase and imcrease the salt content in the bottom phase, which is in agreement with the previous results. But overall, the limits (compositions) of the heterogeneous region remain quite similar. The tie lines and binodal data were satisfactorily correlated with the Bancroft, Othmer-Tobias and Blesadale equations,respectivly . The EEV also increases with the pH. Thus, PEG 1500+ di-potassium tartrate at pH 9.05 is the ATPS with the largest EEV and heterogeneous region.
1.Albertsson, P., Partitioning of Cell Particles and Macromolecules, 1986. In Wiley, New York.
2.Walter, H., Partitioning in aqueous two-phase system: theory, methods, uses, and applications to biotechnology. Elsevier: 2012.
3.Zaslavsky, B. Y., Aqueous two-phase partitioning: physical chemistry and bioanalytical applications. CRC Press: 1994.
4.Lu, Y.-M.; Yang, Y.-Z.; Zhao, X.-D.; Xia, C.-B., Bovine serum albumin partitioning in polyethylene glycol (PEG)/potassium citrate aqueous two-phase systems. Food and bioproducts processing 2010, 88, (1), 40-46.
5.Rocha, M. V.; Nerli, B. B., Molecular features determining different partitioning patterns of papain and bromelain in aqueous two-phase systems. International journal of biological macromolecules 2013, 61, 204-211.
6.Selber, K.; Tjerneld, F.; Collén, A.; Hyytiä, T.; Nakari-Setälä, T.; Bailey, M.; Fagerström, R.; Kan, J.; van der Laan, J.; Penttilä, M., Large-scale separation and production of engineered proteins, designed for facilitated recovery in detergent-based aqueous two-phase extraction systems. Process Biochemistry 2004, 39, (7), 889-896.
7.Rodrigues, G. D.; Teixeira, L. d. S.; Ferreira, G. M. D.; da Silva, M. d. C. H.; da Silva, L. H. M.; de Carvalho, R. M. M., Phase diagrams of aqueous two-phase systems with organic salts and F68 triblock copolymer at different temperatures. Journal of Chemical & Engineering Data 2009, 55, (3), 1158-1165.
8.Rosa, P.; Azevedo, A.; Sommerfeld, S.; Bäcker, W.; Aires-Barros, M., Aqueous two-phase extraction as a platform in the biomanufacturing industry: economical and environmental sustainability. Biotechnology advances 2011, 29, (6), 559-567.
9.Lei, X.; Diamond, A. D.; Hsu, J. T., Equilibrium phase behavior of the poly (ethylene glycol)/potassium phosphate/water two-phase system at 4. degree. C. Journal of chemical and engineering data 1990, 35, (4), 420-423.
10.Peng, Q.; Li, Z.; Li, Y., Experiments, correlation and prediction of protein partition coefficient in aqueous two-phase systems containing PEG and K 2 HPO 4î-¸ KH 2 PO 4. Fluid phase equilibria 1995, 107, (2), 303-315.
11.Hu, R.; Feng, X.; Chen, P.; Fu, M.; Chen, H.; Guo, L.; Liu, B.-F., Rapid, highly efficient extraction and purification of membrane proteins using a microfluidic continuous-flow based aqueous two-phase system. Journal of Chromatography A 2011, 1218, (1), 171-177.
12.Kaul, A., The phase diagram. Springer: 2000.
13.Naganagouda, K.; Mulimani, V., Aqueous two-phase extraction (ATPE): an attractive and economically viable technology for downstream processing of Aspergillus oryzae α-galactosidase. Process Biochemistry 2008, 43, (11), 1293-1299.
14.Bradoo, S.; Saxena, R.; Gupta, R., Partitioning and resolution of mixture of two lipases from Bacillus stearothermophilus SB-1 in aqueous two-phase system. Process Biochemistry 1999, 35, (1), 57-62.
15.Rito-Palomares, M., Practical application of aqueous two-phase partition to process development for the recovery of biological products. Journal of Chromatography B 2004, 807, (1), 3-11.
16.Asenjo, J. A.; Andrews, B. A., Aqueous two-phase systems for protein separation: phase separation and applications. Journal of Chromatography A 2012, 1238, 1-10.
17.Rodrigues, G. D.; de Lemos, L. R.; da Silva, L. H. M.; da Silva, M. C. H., Application of hydrophobic extractant in aqueous two-phase systems for selective extraction of cobalt, nickel and cadmium. Journal of Chromatography A 2013, 1279, 13-19.
18.Pazuki, G.; Kakhki, S. S., A hybrid GMDH neural network to investigate partition coefficients of Penicillin G Acylase in polymer-salt aqueous two-phase systems. Journal of Molecular Liquids 2013, 188, 131-135.
19.Pirdashti, M.; Movagharnejad, K.; Curteanu, S.; Dragoi, E. N.; Rahimpour, F., Prediction of partition coefficients of guanidine hydrochloride in PEG-phosphate systems using neural networks developed with differential evolution algorithm. Journal of Industrial and Engineering Chemistry 2015, 27, 268-275.
20.Taboada, M. E.; Galleguillos, H. R.; Graber, T. A.; Bolado, S., Compositions, densities, conductivities, and refractive indices of potassium chloride or/and sodium chloride+ PEG 4000+ water at 298.15 and liquid-liquid equilibrium of potassium chloride or sodium chloride+ PEG 4000+ water at 333.15 K. Journal of Chemical & Engineering Data 2005, 50, (1), 264-269.
21.Großmann, C.; Tintinger, R.; Zhu, J.; Maurer, G., Partitioning of low molecular combination peptides in aqueous twoâ€phase systems of poly (ethylene glycol) and dextran in the presence of small amounts of K2HPO4/KH2PO4 buffer at 293 K: Experimental results and predictions. Biotechnology and bioengineering 1998, 60, (6), 699-711.
22.de Oliveira, R. M.; Coimbra, J. S. d. R.; Minim, L. A.; da Silva, L. H. M.; Ferreira Fontes, M. P., Liquid-liquid equilibria of biphasic systems composed of sodium citrate+ polyethylene (glycol) 1500 or 4000 at different temperatures. Journal of Chemical & Engineering Data 2008, 53, (4), 895-899.
23.González-Amado, M.; Rodil, E.; Arce, A.; Soto, A.; Rodríguez, O., The effect of temperature on polyethylene glycol (4000 or 8000)-(sodium or ammonium) sulfate Aqueous Two Phase Systems. Fluid Phase Equilibria 2016.
24.Hu, M.; Zhai, Q.; Jiang, Y.; Jin, L.; Liu, Z., Liquid-liquid and liquid-liquid-solid equilibrium in PEG+ Cs2SO4+ H2O. Journal of Chemical & Engineering Data 2004, 49, (5), 1440-1443.
25.Martins, J. o. P.; Mageste, A. B.; Hespanhol da Silva, M. d. C.; da Silva, L. H. M.; PatriÌcio, P. d. R.; Coimbra, J. S. l. d. R.; Minim, L. A., Liquid− Liquid Equilibria of an Aqueous Two-Phase System Formed by a Triblock Copolymer and Sodium Salts at Different Temperatures. Journal of Chemical & Engineering Data 2009, 54, (10), 2891-2894.
26.Taboada, M. E.; Rocha, O. A.; Graber, T. A.; Andrews, B. A., Liquid-liquid and solid-liquid equilibria of the poly (ethylene glycol)+ sodium sulfate+ water system at 298.15 K. Journal of Chemical & Engineering Data 2001, 46, (2), 308-311.
27.Zafarani-Moattar, M. T.; Tolouei, S., Liquid-liquid equilibria of aque