L/S Treatment for HCV Infection in Egypt
Â
Table of Contents
Word Count
Â
Objective. To determine cost effectiveness of adopting L/S versus PEG-R for treatment of HCV infection in Egypt’s National HCV Program.
Methods. Markov model was used to assess health states, associated quality of life, and cost impact for patients age 40 in moderate health using lifetime horizon. Cost-effectiveness was measured through incremental cost effectiveness (ICER) per QALY. One-way sensitivity analysis tested parameter effects of price, age started, time horizon, discount rate and inflation. Probabilistic sensitivity analysis assessed overall parameter with 1,000 iterations.
Results. Base case results show L/S to have higher lifetime costs but also higher expected QALY and life years than PEG-R. ICER per QALY from PEG-R to L/S is EGP 9,291.52 which is below both the Egypt health sector’s upper and lower threshold. One-way sensitivity analysis shows that results are significantly sensitive to price and age started. Probabilistic sensitivity analysis is robust with cost effectiveness at 0.95 for the upper limit and 0.86 for the lower limit of the threshold.
Conclusion. L/S produces higher life years and QALYs than PEG-R, and is more cost-effective amidst higher drug costs. These results are highly sensitive to price, and therefore to the outcome of negotiations by the Egyptian government. These findings should aid the Egyptian government in adopting L/S as their medicine of choice for the National HCV Program, along with other decision making criteria.
HCV. Hepatitis C virus (HCV) infection causes acute and chronic liver disease which causes lower health-related quality of life. Most remain asymptomatic but chronic patients progresses towards cirrhosis, liver failure (increased risk for cancer and signs of decompensation), and death. Transmission is blood-borne, commonly through injecting drug use, non-sterilization of medical equipment, and transfusion of infected blood products. Diagnosis is through screening for HCV antibodies, confirmatory ribonucleic acid test to signal chronic infection, and assessment of liver damage extent with biopsy. There are 6 genotypes of the virus with differing responses to treatment.
Treatment. Antiviral treatment is given with the goal of cure, defined as patients having a sustained virological response (SVR) at least 12 weeks after treatment. Current Egypt guidelines suggest use of pegylated-interferon plus ribavirin (PEG-R) for 6-12 months. PEG-R rates of treatment success vary according to genotype (around 40% for type 1 and 4) and frequently cause side effects such as vomiting and diarrhea which leads to lower compliance.
Alternative treatment. Combination antiviral treatments have been discovered which produce higher proportions of patients achieving SVR. Ledipasvir/ sofosbuvir 90 mg/ 400 mg (marketed as HarnoviTM) by Gilead and has been made available by the European Medicines Agency since 2014 for treatment of adults infected with genotypes 1, 3 and 4. Ledipasvir is an HCV nonstructural protein 5A replication complex inhibitor, while sofosbuvir is a pan-genotypic inhibitor of the HCV NS5B RNA-dependent RNA polymerase. Together, they have shown to achieve SVR in 93-99% of patients post 12-weeks treatment in three uncontrolled phase III studies conducted with treatment naïve and treatment experienced (PEG-R) patients (Gilead Sciences, 2015).
Egypt prevalence. The World Health Organization approximates 700,000 deaths each year from Hepatitis C, with concentrations in Africa and Central and East Asia (World Health Organization, 2016). Egypt has the highest prevalence of HCV in the world with genotype 4 as most prevalent (Lavanchy, 2011). The Egyptian Demographic Health Survey of 2015 estimated the prevalence of chronic HCV to be 10% (95% CI 9.5-10.5) from a nationally representative sample, which was already an estimated 29% reduction from the previous reported prevalence in 2008 (Kandeel et al., 2017).
Egypt response. Alarmed by its high prevalence, the Egyptian government responded by creating an Egyptian National Committee for the Control of Hepatitis in 2006 and investing around USD 80 million each year to cure 20% of HCV patients in Egypt with PEG-R by the end of 2012 (Elgharably et al., 2016). Results found that only 114,000 patients (1.67%) achieved SVR in 2011, and they attribute it to poor patient supervision and compliance given its side effects.
Egypt guidelines. Egypt is one of the few countries in world with explicit guidelines on how to perform and pharmaco-economic evaluations to guide government decision making – which covers aspects including expected study design, pharmacoeconomic method, time horizon, choice of outcome measures, costs determination, modeling, discounting, uncertainty, and presentation of study results (Ministy of Health, 2013).
Study objectives. This economic evaluation aims to guide government decision making on adopting Ledipasvir/Sofosbuvir (L/S) for treatment of HCV infection in their National HCV Program, in compliance to local guidelines.
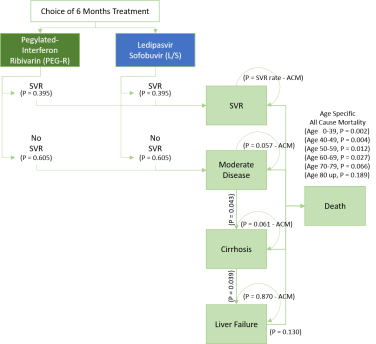
Model. Markov model was used showing the relationship among health states (Figure 1) based on previous literature on HCV natural course. People in moderate disease may attain SVR (negative HCV RNA result after 12 weeks of treatment) and is assumed non-reversible (i.e. once in SVR, people will not be re-infected with HCV). Those that do not respond to treatment will progress towards cirrhosis, liver failure, and death. There is possibility of death from any of the health states through all-cause mortality. Values used in the model are summarized in Appendix 1.
Figure 1. Markov Model
Target population. The intervention is aimed at patients with chronic HCV at moderate stage, wherein treatment is believed to cause cure or SVR. Egypt’s average age of presentation is 40 years old (Kandeel et al., 2017) which was basis for screening age of the ongoing National HCV Program. Age 40 as starting age was used in this analysis.
Time horizon. As recommended by Egypt’s guidelines, lifetime horizon was used to account for the chronic condition of the disease. This was defined in the model as the cycle and age at which all patients using current guidelines (PEG-R) are in death state, and zero additional QALY is added in an additional cycle or age 95 at 65 cycles.
Effectiveness parameters. Data from effectiveness parameters are taken from non-randomized studies since no head-to-head comparison exists at the moment. Values used in the model are 0.395 (0.02) for PEG-R and 0.92 (0.03) for L/S (Grieve & Sadique, 2016).
Probabilities data. Data used to estimate transition probabilities were used as given (Grieve & Sadique, 2016). These are moderate to cirrhosis at 4.3% (0.01), cirrhosis to liver failure at 3.9% (0.01) and liver failure at 1.3% (0.02). Data used for all-cause mortality are taken from the same source and are 0.2% for age 0-39, 0.4% for age 40-49, 1.2% for age 50-59, 2.7% for age 60-69, 6.6% for age 70-79, and 18.9% for age 80 above.
Utility values. Utility values used to calculate Quality Adjusted Life-Years (QALY) derived from a survey of UK patients at different disease stages using the Euroqol (EQ-5D-3L) questionnaire. Average utility for SVR is 0.71 (0.05), moderate 0.6 (0.054), cirrhosis 0.55 (0.054), liver failure 0.45 (0.054). (Grieve & Sadique, 2016)
Costs. Costs data comprise of cost of antiviral treatment and cost associated with a specific health states. As given (Grieve & Sadique, 2016), average cost of 6 months of PEG-R is EGP 4245 (1,274). Current retail price of L/S for the 6-month treatment is EGP 400,000 pounds, but the Egyptian government is on negotiations for probable 90% discount. The L/S cost used in base case analysis is EGP 40,000 (12,740) to reflect the negotiation (real amount government is willing-to-pay) for the intervention. Costs associated with monitoring, indirect health costs, and others that may be similar across both interventions are excluded to conform with Egypt’s guidelines (Ministy of Health, 2013). Annual cost associated with HCV treatment in 2015 at moderate health state is EGP 900 (210), at cirrhosis is EGP 2,500 (1,060), at liver failure is EGP 4,400 (2,33), and EGP 0 for both SVR and death. (Grieve & Sadique, 2016)
Adjustment for inflation. Egyptian guidelines indicate that costs should be inflated to the most recent calendar year using the Consumer Price Index (CPI) for health, with reference to Ireland guidelines on methods (Health Information and Quality Authority, 2010). This was computed from medical care CPI as published by the Central Bank of Egypt (2016) in its Monthly Inflation Developments from January to December 2016 using the formula {[(Latest Index Number/Earlier Index Number)x100] – 100} for inflation factor (Appendix 2).
Discount rate. Egyptian guidelines (Ministy of Health, 2013) indicate the use of 3.5% discount rate for both costs and health gains in the base case, and varied from 2% to 6% in sensitivity analysis.
Threshold. Although the Egyptian government does not use an explicit threshold for adoption of new medicines, previous economic evaluations approved and promoted by the Egyptian Pharmacoeconomic Unit (Elsisi et al, 2014; Elsisi et al, 2014) use the World Health Organization (WHO) recommendation of threshold at 1-3 times gross domestic product (GDP) per capita for one Disability Adjusted Life Years (DALY). Articles in the government newsletter also defend corresponding use of QALY indicating that “despite differences in DALY and QALY, one can assume they are similar to be able to put a value on the outcome”. The GDP per capita used in the evaluation was taken form the most recent Annual Financial Report of Egypt’s Ministry of Finance (2016) at EGP 27,625.
Cost effectiveness analysis. Incremental cost effectiveness ratios (ICER) were computed from the difference in total costs after discounting and inflation and difference in total QALY after discounting between PEG-R and L/S.
Deterministic statistical analysis (DSA). DSA, as recommended by Egyptian guidelines, assessed parameter uncertainties theorized to affect the results of the economic evaluation using the following scenarios:
- Price. The price of L/S was varied in relation to the ongoing negotiations. No discount (EGP 400,000) and 99% discount (EGP 4,000) was used for worst-best case scenario analysis. Best case scenario was derived from real results of the negotiation between manufacturers and the Egyptian government (Fick & Hirschler, 2014).
- Age started. Egypt’s current National HCV Program prioritizes patients with more advanced forms of liver disease, where more than half of the beneficiaries are in their 40s or 50s. In a study run by the Ministry of Health in 2011, the mean age was 41 years with a standard deviation of approximately 10 years (Kandeel et al., 2017). For sensitivity analysis, one standard deviation above and below the mean age was considered for age of treatment start, which was age 50 and age 40 respectively.
- Time horizon. While lifetime horizon was defined as age at which all patients die in the base model, average life expectancy in Egypt is 71 years old (The World Bank, 2016). Average time to introduce significantly new drugs is between 10-20 years (PHRMA, 2015) and upper limit was used as alternative endpoints of the evaluation to account for possible change in cost-effectiveness come new treatment options.
- Discount rates. The recommended alternative discount rates as published by Egyptian guidelines (Ministy of Health, 2013) of 6% and 2% were used.
- Inflation. Health specific inflation rates were used for base case analysis, but these are nominally much higher than overall inflation. Analysis was done against the range of normal inflation according to the Central Bank of Egypt (Egypt, 2016), with lowest inflation rate seen in 2005 (at 4.869%) and highest in 2016 (at 25.858%). These figures were rounded to 5% and 25% in the sensitivity analysis respectively.
Probabilistic sensitivity analysis (PSA). Although PSA is not recommended by Egyptian guidelines, it was performed to assess overall parameter uncertainty. Point estimates were replaced with values sampled from statistical distributions (beta distribution for probabilities and utility values and gamma distribution for costs data). ICER per QALY was recalculated for 1,000 times to predict likelihood that the results would be cost effective against both the upper and lower limit of the thresholds.
Base case results. L/S are shown to have higher lifetime costs but with higher expected QALY and life years than PEG-R, as shown in Figure 2. ICER per QALY from PEG-R to L/S is EGP 9,291.52 which is acceptable for both the Egypt health sector upper threshold of three times GDP per capita (Current GDP EGP 27,625 x 3 = EGP 82,875) and WHO’s lower value for threshold of one GDP per capita (EGP 27,625).
Figure 2. Base Case Results
|
ICER |
Life Years |
QALY |
Cost |
ICER per Life Year |
ICER per QALY |
|
PEG-R |
17,297 |
11,291 |
EGP 40,657,657.80 |
EGP 17,589.34 |
EGP 9,291.52 |
|
L/S |
17,998 |
12,619 |
EGP 53,002,155.00 |
||
|
Difference |
702 |
1,329 |
EGP 12,344,497.20 |
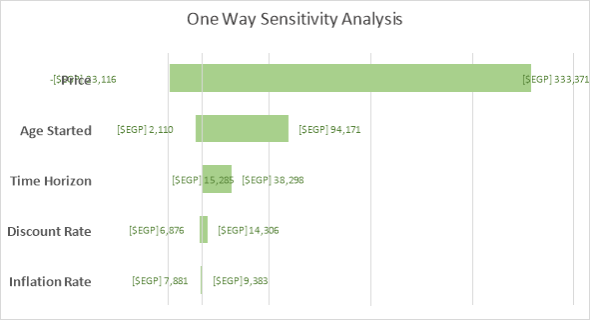
DSA Results. One-way sensitivity analysis shows that our results are significantly sensitive to price and age started in relation to Egypt’s willingness-to-pay threshold. If using the lower limit of WHO’s recommendation for threshold at one times GDP per capita, time horizon is included in the parameters that make the result sensitive. The results are not sensitive to variation in discount rate and inflation rate as shown in the Tornado Diagram (Figure 3).
Â
|
Figure 3. Tornado Diagram |
|||||||||||||||||||||||
|
|
|||||||||||||||||||||||
|
EGP amounts indicate ICER per QALY using the values from upper and lower limits as stated in the table. |
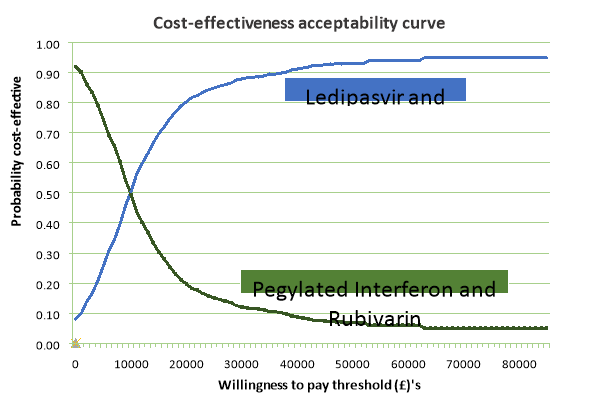
PSA Results. The spread of results from simulations are shown in a cost-effectiveness plane (Figure 4) and cost-effectiveness acceptability curve (Figure 5). PSA results show that cost effectiveness is at 0.95 for the upper limit and 0.86 for the lower limit of the threshold. The model can be seen as robust to uncertainty.
Â
Figure 4. Cost Effectiveness Plane after PSA
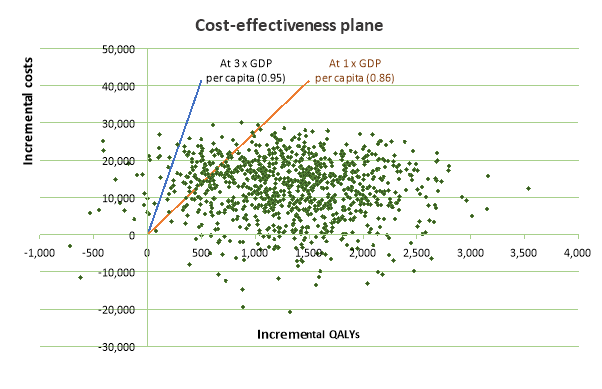
Figure 5. Cost Effectiveness Acceptability Curve after PSA
Strengths. The model values are adjusted to reflect reality i.e. costs adjusted for inflation, all data discounted. Lifetime analysis takes into account more accurate progression given the chronic nature of the disease. Methodological and structural uncertainty were assessed through DSA and parameter uncertainty through PSA, which confirmed results of the base case analysis towards the likelihood of the scenarios.
Limitations. The results are limited by the best availability of data, and possible residual confounding factors remain. Probabilities used for L/S were both from HCV genotypes 1 and 4, while Egypt’s most common genotype (>90%) is 4. It is also unclear if probabilities are from target groups or general population, which could slant results and cause unethical recommendations. The Egyptian government also conducted an update of the HCV survey in 2015 (Kandeel et al., 2017) that showed decreased HCV prevalence and different patterns of progression which were not included in this analysis. We also did not consider indirect costs nor disutility from taking the medicines as these are not being measured. These could have contributed the ICER result leading to acceptable values.
Policy issues. Although results indicate L/S is cost-effective given current thresholds, realistic implementation and willingness of government to fund the intervention as opposed to other conditions remain uncertain. Egypt does not have a local threshold and adopts WHO’s recommended of three times GDP per capita, which may be too high and unsustainable for their health system. A threshold grounded with budget impact analysis is recommended to make better cost-effectiveness recommendations. Also, other criteria such as presence of current drugs for the condition and equity considerations are being used in decision making for adoption of medicines in Egypt (Kandeel et al., 2017).
Further research. Current findings suggest better cost-effectiveness at earlier starting age of treatment which should be explored. Incorporating indirect costs and disutility from taking PEG-R and L/S would also provide a better reflection of reality, especially given the failure of the previous PEG-R program to meet theoretical SVR rates due to treatment side effects. Research on societal perspective would also help increase likelihood of success of the national HCV program.
Key Message. L/S produces higher life years and QALYs than PEG-R. Amidst higher costs, providing L/S to the population is still more cost-effective and is acceptable under Egypt’s current willingness-to-pay thresholds, both at lower and upper limits. These are similar to cost-effectiveness studies done with newer drugs such as sofosbuvir alone(Cure, Guerra, & Dusheiko, 2015), as no current head to head comparisons between PEG-R and L/S exists (Grieve & Sadique, 2016). However robust the results, sensitivity analysis reveals that these favorable results are dependent on key drivers such as the outcome of the price negotiations of L/S currently being done by the Egyptian government.
These findings should aid the Egyptian government in adopting L/S as their medicine of choice for the National HCV Program, along with other decision making criteria. In learning from previous program’s failures, shifting to L/S will not meet desired SVR values unless coupled with monitoring capabilities and strategies to improve patient compliance.
Â
Cure, S., Guerra, I., & Dusheiko, G. (2015). Cost-effectiveness of sofosbuvir for the treatment of chronic hepatitis C-infected patients. Journal of Viral Hepatitis, 22(11), 882-889. https://doi.org/10.1111/jvh.12409
Egypt, C. B. of. (2016). Headline and Core Inflation – January to December 2016. Retrieved from http://www.cbe.org.eg/en/MonetaryPolicy/Pages/MonthlyInflationNote.aspx
Egypt Ministry of Finance. (2016). General Economic and Financial Outlook. Retrieved from http://www.mof.gov.eg/MOFGallerySource/English/Reports/monthly/2016/December2016/section 1.pdf
Elgharably, A., Gomaa, A., Crossey, M., Norworthy, P., Waked, I., & Taylor-Robinson, S. (2016). Hepatitis C in Egypt – past, present, and future. International Journal of Geraitric Medicine, 10, 1-6. Retrieved from https://www.ncbi.nlm.nih.gov/pmc/articles/PMC5191841/
Elsisi, G., Ragab, S., Ashraf, R., & Elmadawy, M. (2014). Cost-effectiveness of Drug eluting Stents Versus Bare Metal Stents in Egyptian Diabetic Patients. Egyptian Pharmacoeconomic Unit, Central Administration for Pharmaceutical Affairs Newsletter, 1(1). Retrieved from http://www.eda.mohealth.gov.eg/Files/407_Pharmaco Economics Newsletter 1-7.pdf
Fick, B. M., & Hirschler, B. (2014, March 21). Gilead offers Egypt new hepatitis C drug at 99 percent discount. Health News, Reuters, pp. 5-6. Cairo/ London. Retrieved from http://www.reuters.com/article/us-hepatitis-egypt-gilead-sciences-idUSBREA2K1VF20140321
Gilead Sciences. (2015). Ledipasvir/Sofosbuvir, 90mg/400mg, film-coated tablet (Harvoni®) SMC No. (1030/15). Retrieved from https://www.scottishmedicines.org.uk/files/advice/ledipasvir_sofosbuvir_Harvoni_FINAL_February_2015_for_website.pdf
Grieve, R., & Sadique, Z. (2016). Economic Evaluation (C1-1501) Reader. London.
Health Information and Quality Authority. (2010). Guidelines for the Economic Evaluation of Health Technologies in Ireland. Retrieved from http://www.ispor.org/PEguidelines/source/Ireland_Economic_Guidelines_2010.pdf
Kandeel, A., Genedy, M., El-Refai, S., Funk, A. L., Fontanet, A., & Talaat, M. (2017). The prevalence of hepatitis C virus infection in Egypt 2015: Implications for future policy on prevention and treatment. Liver International, 37, 45-53. https://doi.org/10.1111/liv.13186
Lavanchy, D. (2011). Evolving epidemiology of hepatitis C virus. Clinical Microbiology and Infection, 17(2), 107-115. https://doi.org/10.1111/j.1469-0691.2010.03432.x
Ministy of Health. (2013). Guidelines for Reporting Pharmacoeconomic Evaluations. Egypt. Retrieved from http://www.eda.mohp.gov.eg/Files/402_Egyptian_Pharmacoeconomic_guidelines.pdf
PHRMA. (2015). Biopharmaceutical Research & Development : The Process Behind New Medicines. Retrieved from http://phrma-docs.phrma.org/sites/default/files/pdf/rd_brochure_022307.pdf
The World Bank. (2016). Life expectancy at birth, total (years) – Egypt. The World Bank. Retrieved from http://data.worldbank.org/indicator/SP.DYN.LE00.IN?locations=BE
World Health Organization. (2016). Hepatitis C Fact Sheet. Retrieved February 1, 2017, from http://www.who.int/mediacentre/factsheets/fs164/en/
Appendix 1 – Summary of Variables for the Model
|
SUMMARY OF VARIABLES FOR THE MODEL |
|||||
|
Category |
Variable |
Name Label |
Value |
STD |
Distribution |
|
Effectiveness of Regimen |
Pegylated Interferon and Rubivarin |
tp_svr_peg |
0.395 |
0.02 |
beta |
|
Ledipasvir and Sofosbuvir |
tp_svr_ls |
0.92 |
0.03 |
beta |
|
|
Transition Probabilities Bet. Health States |
Moderate to cirrhosis |
tp_mod-cir |
0.043 |
0.01 |
beta |
|
Cirrhosis to liver failure |
tp_cir-liv |
0.039 |
0.01 |
beta |
|
|
Liver failure to HCV related death |
tp_liv-dea |
0.13 |
0.02 |
beta |
|
|
All Cause Mortality |
Age 0-29 |
acm2 |
0.002 |
||
|
Age 30-39 |
acm3 |
0.002 |
|||
|
Age 40-49 |
acm4 |
0.004 |
|||
|
Age 50-59 |
acm5 |
0.012 |
|||
|
Age 60-69 |
acm6 |
0.027 |
|||
|
Age 70-79 |
acm7 |
0.066 |
|||
|
Age 80+ |
acm8 |
0.189 |
|||
|
Quality Adjusted Life Years for Each Health State |
Sustained virological response (SVR) |
qaly_svr |
0.71 |
0.05 |
beta |
|
Moderate |
qaly_mod |
0.66 |
0.054 |
beta |
|
|
Cirrhosis |
qaly_cir |
0.55 |
0.054 |
beta |
|
|
Liver failure |
qaly_liv |
0.45 |
0.054 |
beta |
|
|
Death |
qaly_dea |
0 |
0 |
||
|
Costs of Health States |
Sustained virological response (SVR) |
cost_svr |
0 |
||
|
Moderate |
cost_mod |
900 |
210 |
gamma |
|
|
Cirrhosis |
cost_cir |
2500 |
1060 |
gamma |
|
|
Liver failure |
cost_liv |
4400 |
2335 |
gamma |
|
|
Death |
cost_dea |
0 |
|||
|
Costs of Interventions |
Pegylated Interferon and Rubivarin |
cost_peg |
4245 |
1274 |
gamma |
|
Ledipasvir and Sofosbuvir |
cost_ls |
40,000 |
12740 |
gamma |
|
|
Assumptions |
Years in cycle |
1 |
|||
|
Age of start |
40 |
||||
|
Discount rate |
discount |
3.5% |
|||
|
Medical inflation rate |
inflation |
23.79% |
|||
|
GDP per capita (2015, WB) |
gdp |
27625 |
|||
Â
Appendix 2 – Computation of Medical Inflation
|
Medical Care – Consumer Price Index |
||
|
2015 |
2016 |
|
|
January |
131.17 |
143.32 |
|
February |
131.17 |
143.32 |
|
March |
131.17 |
149.26 |
|
April |
131.17 |
149.26 |
|
May |
131.17 |
172.48 |
|
June |
131.17 |
172.48 |
|
July |
131.69 |
172.48 |
|
August |
131.69 |
172.48 |
|
September |
136.64 |
172.48 |
|
October |
136.64 |
172.67 |
|
November |
143.32 |
182.63 |
|
December |
143.32 |
190.51 |
|
Average |
134.1933 |
166.1142 |
|
Medical Inflation Factor |
23.79% |
|
|
Formula Used |
[(Latest Index Number/Earlier Index Number) x 100] – 100 |
|
Methodology Retrieved From |
How to Inflate Retrospective Health Costs using the Consumer Price Index for Health https://www.ispor.org/PEguidelines/source/Ireland_Economic_Guidelines_2010.pdf |