Motion-Powered Portable Charger
The focus of this project is to design a Motion-powered portable charger for electronic mobile devices. The interest in electronic mobile devices has led to power supply problems. Most of the devices need a continuous power supply to be fully functional. This project is thought to design a solution to give almost unlimited power supply to charge the electronic mobile devices through movements of the users themselves. The energy is expected to be harvested from electromechanical devices such as ‘Faraday’s hand-held generator’ or ‘piezoelectric’. The energy is then converted and altered to electrical energy depending on the required output power. This project would not only give almost unlimited power supply but it also would help in improving green technology and more efficient too. Simulation of the circuits in this project were created using Multisim.
In the name of God, the Most Beneficent and Most Merciful.
The report being submitted is a result of collective effort. There are numerous direct and indirect helping hands who have guided through the whole project. Writing this report appeared to be a great experience and it have added a lot additional knowledges. This is one of memorable experiences and memories in a student life.
Though words are inadequate in offering thanks to our lecturers but I owe my profound gratitude to my supervisor, Dr. Mohamed K Darwish for accepting me to be his supervisee. I also submit my heartiest gratitude to him for be giving me guidance and useful suggestions over the months in finishing this project, which is unmeasurable and without it I would not be where I am today.
I am also deeply indebted to this EE3600 module leader, Dr. Takebumi Itagaki, who went all out to provide me every possible support and seminar presentation on project management and writing report.
Next, my greatest gratitude is for the laboratory Chief technicians, Mr. Matthew Smith and fellow technicians, Mr. Guillermo Schkzamian and Mr. Michael Lateo, for providing me helps with the facilities throughout the project.
Next, I also would like to express our heartfelt thanks to Public Service Department of Malaysia for sponsoring my education here in Brunel University London.
Finally, yet importantly, I also wish to express appreciation to my beloved parents for cooperation, help, kindness and blessings and not fto be forget, our family members, friends and other lecturers for their helps and wishes for the successful completion of the work.
2.1Fundamentals of Kinetic Energy and Mechanical to Electrical Energy
2.2Theory of Lithium ion Battery
2.2.1Principles of Charging and Discharging Stage of Lithium ion battery
2.2.2Environmental Temperature
3.2Kinetic/Mechanical to Electrical Energy Converter
3.3.1Power Supply of the Charger
1.1 Project Title
Motion-powered Portable Charger
1.2 Aim
The aim of this project is to design a motion-powered charger that allows electronic devices users to keep on charging their electronic devices from running movement of the users. To achieve this, the charger is expected to harvest enough motion from running to replenish cell phones or other small gadgets, like GPS devices.
1.3 Objectives
The objectives of this project are as follows:
- Choosing the best electromechanical devices to charge the battery in the portable charger
- Testing the understanding of charger circuits which also includes AC-DC converters, amplifiers and other many minor circuits of an electronic devices
- Understanding in method to store energy in lithium-ion battery to be used to charge electronic portable devices
- Measure the efficiency of the devices ; input and output voltage, current and power of the charger
- Produce useable motion-powered portable charger
1.4 Learning Outcome
Learning outcomes of this project are:
- Manage to understand the mechanism of charging and discharging condition of lithium-ion battery
- Understand on how to increase both voltage and current to required voltage and current
- Improve problem solving and decision-making skills for sudden mistakes discovered throughout the projects
- Have the confidence in designing an electronic and electrical circuits.
- Understand on files needed to produce a printed circuit board (PCB)
- Develop soldering skills so a PCB would be fully functional
1.5 Materials Required
- 18mm OD x 2mm WT x 12″ long Perspex Tube
- 30 SWG Enamelled Copper Magnet wire
- LM324N OpAmp
- LM7812CT Single Linear Voltage Regulator
- TIP122G NPN Darlington Transistor
- 1N4148 Diode
- DC-DC 5V 1A/2A Boost Converter
- BZX79C 4.7V Zener Diode
- 10k Ω Potentiometer
- Resistors:
- 1 Ω
- 560 Ω
- 1k Ω
- 1.5k Ω
- 2.7k Ω
- 4.7k Ω
- 10k Ω
- 100k Ω
- 1M Ω
- Capacitors
- 10nF
- 100nF
1.6 Project Planning
With a project with many different schedules and tasks that need to be completed project planning was an essential part to designing and building a functioning system. There is a time plan of the whole project in Appendix A – Project Planning.
2.1 Fundamentals of Kinetic Energy and Mechanical to Electrical Energy
2.1.1 Faraday’s Law
Initially, in 1821, a Danish physicist and chemist, Hans Christian Oersted, found a phenomenon so called electromagnetism. Soon after the discovery, a British scientist, William Hyde Wollaston, tried to design an electric motor using the fundamental theory of electromagnetism. However, his effort make no results and failed to create the motor [1].
Michael Faraday who have talked to both initiators of the theory started his experiments and managed to produce the very first electric motor. Since he is the only who published his works, he was credited for discovering the theory of induction in 1831 without acknowledging Wollaston [2]. This law predicts how magnetic field would related to electric field which then could produce electromotive force (EMF), a phenomenon generally called Electromagnetic Induction [2]. This law is applied as the basic fundamental theory for many applications such transformers, inductors, electric motors and in this project case, as a generator [2].
However, most of the scientists rejected the Faraday’s theory since it was not represented mathematically [1]. But only James Clerk Maxwell accepted the theory and described the law as Faraday’s Law of Induction mathematically which then later generalized to be called the Faraday-Maxwell Equation1 [1][3]. This equation is one of the four so called Maxwell’s Equation throughout all of his theory about electromagnetism [1].
Faraday’s Law of Induction surely needs the magnetic flux  through a loop of wire [4]. The definition of magnetic flux is given by:
where B is the magnetic field and dA is surface integral enclosed by the loop of wires.
In term of graphical definition, magnetic flux through the loop of wire is directly proportional to the number of magnetic flux lines been cut when the magnet pass through the loop of wire [4].
2.1.2 Lenz’s Law
The Faraday’s Law of Induction also states that when the magnetic flux that pass through the loop of wire changed, the loop of wire gained an EMF. Generally, this statement means that the induced EMF in closed circuit is defined as rate of change of magnetic flux made from the circuit [5][6]. The definition in term of equation is as below:

where  is the EMF while
  is the magnetic flux
The Faraday’s Law of Induction is then further modified and improved by physicist named Heinrich Lenz. The improvised law is called as Lenz’s Law. This law, of which gives the direction of the EMF, states that the direction of the induced current is opposite of the direction of the change that produced it because of the negative sign shown in the equation above [7]. In order to increase the induced EMF, it is known to customize the flux linkage since EMF is also known as rate of change of flux. This can be done by wounding coil of wires tightly producing N turns of wires, which each of the turn have the same magnetic flux. The EMF produced through this method is N times of one single turn of wire [8] [9].
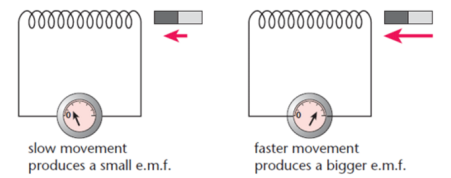
Figure 1: Faraday’s Law of Induction producing EMF
The theory from the Faraday’s Law of Induction due to magnetic flux linkage been cut by loop of wire then become the fundamental principle in making electrical generators. This could be happened when a conductor or loops of wires is moved relative to permanent magnet or vice versa producing EMF. If both ends of the opened-circuit wires is connected to any electrical devices, current will be produced and electrical energy is produced. This electrical energy is gained from the motion of the magnet which then proves the conversion of mechanical energy to electrical energy.
2.1.3 Piezoelectricity
Piezoelectricity is the ion charges which are collected in abundant amount in some solid materials, such as ceramics and crystal, and biological matter, for example DNA and bones [10]. This could only be happened when mechanical stress is applied onto the particular substances. It is understood that piezoelectric effect was a result of linear electromechanical contact between electrical and mechanical state in materials whose structure are in highly microscopic structure order. These materials used for piezoelectricity are normally have no inversion symmetry [11].
During the early mid of 18th century, the early discovery and research was studied by Carl Linnaeus and Franz Aepinus. However, the study was on pyroelectric effect. This pyroelectric shows that an electrical potential of a substances or material are produced whenever there is temperature changes [12]. From this discovery, Rene Just Hauy and Antoine Cesar Becquerel conclude a relationship between electric charge of a substances or materials with mechanical stress applied onto it. Despite of their experimental efforts to prove the relationship, they are likely fail to prove the experiments conclusive [12].
Unable to full understand the principle, in 1880, The Curie brothers, Pierre Curie and Jacques Curie manage to demonstrate the very first direct piezoelectric effect [13]. The brothers manage to predict the behaviour of crystal by combining their knowledge on pyroeletricity with their understanding about the crystal structure. The effect was demonstrated by the brothers using tourmaline (crystalline boron silicate mineral), topaz (silicate mineral of aluminium and fluorine), cane sugar and Rochelle salt (sodium potassium tartrate tetrahydrate) Quartz (mineral composed of silicon and oxygen) [13].
However, the converse piezoelectric effect wasn’t predicted by the brothers. Only in the next year, 1881, Gabriel Lippmann managed to deduce the converse effect from the basic principles of thermodynamics mathematically [13]. Only then, the Curie brothers got to obtain the verification of the changeability of the deformations in the piezoelectric crystals and thus proved the presence of the converse effect [13].
The very first application of piezoelectric devices was as in sonar. It was first developed by Paul Langevin and his assistants during World War 1 at France which was about 1917 [13]. Starting from this creation where piezoelectric effect was used in sonar, the development of its technology and applications was intensely explored and developed. The most common application was found to be the piezoelectric sensor.
Piezoelectric sensor, as known from its name, of course uses piezoelectric. This sensor detects any changes in pressure, force, temperature, stress or strain in form of electrical charge. This is one of the reason why it is called electromechanical devices as it generally converts mechanical energy to electrical energy
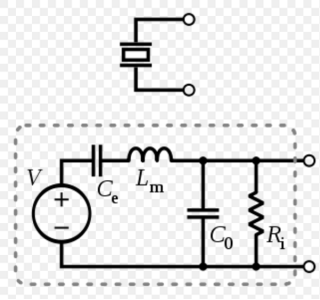
Figure 2: Electronic and schematic symbol of a piezoelectric sensor
The electrical properties of the sensor are that it has very high DC output impedance. This makes the sensor could also be sculpted as proportional voltage source or network filter [14]. Voltage across the source is directly proportional to any force, stress, strain or pressure applied onto it. The current passed through the circuit then will shows as output signal of the sensor of which specifically shows the result of the mechanical force applied [14].
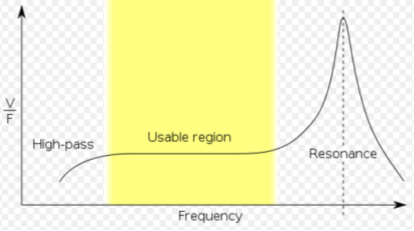
Figure 3: Frequency response of piezoelectric sensor
If it is intensely considered, the effects of the mechanical construction and other ingenuity of the sensor are included in the specified model. To make it function as sensor, the straight region (usable region) of the frequency response will normally be used [14]. As an effort to ensure that the low frequencies of interest (straight region) not lost, the leakage and load resistance must be sufficiently large. In this region, a corresponding circuit which has been abbreviated can be used. From the circuit, the capacitance of the sensor is signified by CS of which is defined by the general formula for capacitance of parallel plates [14]. However, the device can also be showed as charge source. This could only be happened if CS is in parallel yet the charge is still directly proportional to applied force [14].
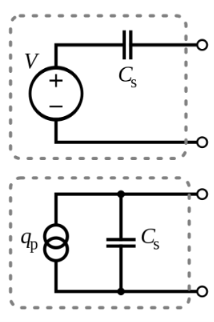
Figure 4: Piezoelectric sensor as voltage source or charge source
The principle operation of a piezoelectric material can be divided into 3 main operative modes:
- Longitudinal effect
The total charge displaced does not depend on the dimension and shape of the piezoelectric elements. Yet, the amount charge displaced is directly proportional to the force or pressure. The one and only technique to surge the output charge is by placing a few piezoelectric elements in parallel as from electrical perspective but in series as from mechanical perpective. The output charge is as below:

where  is the piezoelectric coefficient as a charge in x-axis are being discharged by the forces exerted onto the same x-axis.
  , is the force exerted in the x-axis while
  is representing the number of elements that been fixed together.
- Shear effect
The charges formed does not depend on the dimension and size of the piezoelectric elements at all and yet it is totally and directly proportional to the force and pressure exerted. The charge for elements which is placed in parallel as from electrical perspective but in series as from mechanical perspective can be illuminated as below:

- Transverse effect
Charges along x-axis are displaced perpendicularly to a force that been applied along a neutral y-axis. The geometrical proportions of certain piezoelectric component determined the amount of charge displaced, CX.
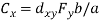
where  is the proportion coordinated with the neutral axis,
  is coordinated with the charge producing axis while
  is the equivalent coefficient
2.2 Theory of Lithium ion Battery
Amongst rechargeable battery that ever exist, lithium ion battery is known to be amongst the battery with highest capability to store energy per unit volume. This is one of the reason why lithium ion battery is considered to be useful for electrical energy storage [15]. Besides, lithium ion battery is also known for its capability and efficiency in charging and discharging [15].
However, there is also disadvantages of using this lithium ion battery. Comparing to capacitors and other different kind of batteries, it is essential for this lithium based battery to be charged using a definite voltage and restricted current [15]. If the condition is not fulfilled, the useful used-to-store-energy battery could be one of the dangerous battery as it could potentially be fire-starting bomb [15].
2.2.1 Principles of Charging and Discharging Stage of Lithium ion battery
The very foremost thing that need to be understood about discharging and charging a battery is its C-rate which is the foundation of battery usage. Generally, the batteries are characterised with nominal capacity which is measured in ampere-hour (Ah). But most of the time, the batteries are labelled in milliampere-hour (mAh) [15]. The label actually explains the amount of current supplied within one hour during the discharging state of the battery before the battery are fully depleted [15].
As an example, a battery labelled with 10000mAh which might be also labelled as 10Ah, could only push 10A to a circuit. If the battery is being discharged through the circuit with 10A but last for 1 hour, it said that the battery would have 1C discharge rate. It is also said to be discharged at rated capacity current. However, the discharge rate would only be 0.5C when the battery only provides 5A or 5000mA to a circuit. However, with 0.5C discharge rate, the battery would last for two hours [15]. Some batteries do tolerate for higher discharging rate compared to 1C, but it couldn’t last longer than 1C discharge rate.
As for charging condition, the theory is generally the same. At 0.5 charging rate, the same battery that labelled 10000mAh would be charged with maximum current of 50000mA [15]. However, comparing to discharge rate of a battery, most of the batteries are only charged at 0.5 to 0.7C charging rate because of safety and to have long-life battery [15].
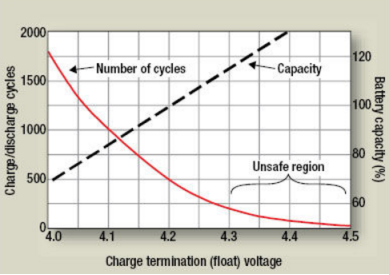
Graph 1: Lithium ion battery cycle life, capacity and float voltage are interrelated
From the graph above, it is concluded that each cell of most of the lithium ion batteries are only charged to 4.2V maximum. This is because charging using higher voltages might reduce the battery life even though the capacity of the battery are improved [16]. On the other hand, charging the battery using a lower voltage might increase the charge cycles but the run time of the battery are reduced [16].
Many batteries can be classified as over-discharged when the cell voltage of the battery is below 2.8V or 3V. When this happened, the battery can still actually be recharged and used [16]. However, a stage called aconditioning stage need to be done before the battery is charged again. Within the stage, the battery is only charged with 0.1C charging rate [16]
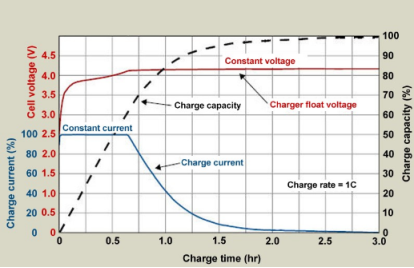
Graph 2: The constant current, constant voltage charge profile of lithium ion battery
The charge cycle of lithium ion battery is illustrated by the graph above. Generally, every charge cycle of single lithium battery contains two main stages which is Constant Current (CC) and Constant Voltage (CV). However, some chargers which charge series of lithium ion battery have an extra stage that is called Balancing Stage [16]. Explanation for each stage [16] is explained as below:
- Constant Current (CC) :
This stage is always used by all the chargers and it is the one and only stage aimed at the fastest chargers. Generally, the battery is connected to current-limited power supply during this early stage. The limited current is normally 0.5 to 0.7 of the nominal capacity of the battery. The limited current flows continuously and constantly until the voltage of the battery cell reaches 4.2V. At this very moment, the charge of battery is expected to be around 70 to 80% [16].
- Constant Voltage (CV)
This stage is also known as the saturation stage. In this stage, the charger turns its role into voltage-limited power supply. Contradictly from the previous stage where voltage of the battery continues to be unchanged, the charge current decrease steadily. The battery is only acknowledged to be fully charged when the charge current is valued to be 3 to 10% of the rated capacity [16].
- Balancing Stage
As told before, this stage is normally only when series of lithium ion batteries need to be charged. In this stage, the charging current is normally lowered or in some cases, the charger is automatically and rapidly turned on and off in order to decrease the average current. At the same time, the charge of each battery cell is kept to the equal level. This was done by a circuit called balancing circuit. The stage will stop only when the batteries are found to be balanced.
2.2.2 Environmental Temperature
Generally, lithium-ion battery give best charging performances only at cool temperature. The temperature accepted for the best performances ranging from 5 °C to 45 °C. Sometimes, the battery might even offer fast-charging within the accepted temperature [15].
It is also possible to charge the battery at low temperatures (below 5 °C). However, the cost to charge at low temperature is that the charge current will be reduced and indirectly, it would take long times for the battery to be fully charged. When the battery is charging in the low temperature, any increment in the temperature which is caused by the internal resistance of the cell would highly be beneficial even though it only small increment.
On the other hand, charging the lithium ion battery in high temperatures can cause the battery to be degraded. Besides, charging the battery at high temperature (above 45 °C) also might lead to degradation of the battery performances.
3.1 Introduction
In order to simplify the design and build the system, the project was split into modules. The project modules were initially designed to be like in the block diagram below.
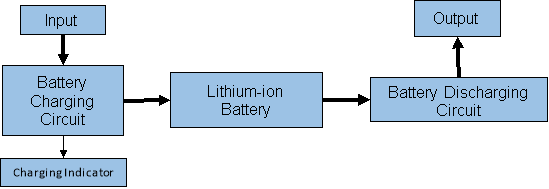
Figure 5: Initial flow chart of the motion-powered portable charger
The modules were later adjusted based on the knowledge gained from the literature review. The adjusted modules are shown as below.
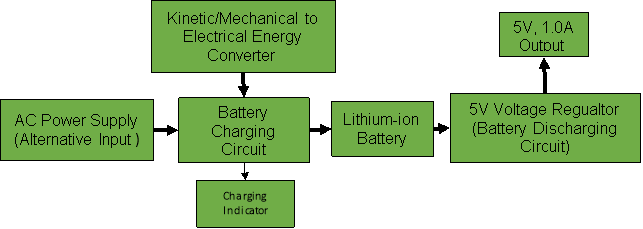
Figure 6: Final flow chart of the motion-powered portable charger
From the flow chart above, it can be seen that the input of the system is made to have two inputs. As for the system, the main input supposed to be the ‘Kinetic/Mechanical to Electrical Energy Converter’. However, the other input which is the ‘AC Power Supply’ is also considered because it is made to be the alternative input just in case if there is any system failure in the main input.
From the flow chart, there are three modules that are available in the market and would be useful for the system. The modules are AC Power Supply, Lithium ion Battery and 5V Voltage Regulator.
3.2 Kinetic/Mechanical to Electrical Energy Converter
In this module, the design choice to generate the electricity which are harvested from kinetic or mechanical energy have been made. The design choice that have been made uses Faraday’s Law of Induction and Lenz’s Law. Faraday’s Law of Induction applies that an electromotive force (EMF) will be produced when there is change in magnetic flux when a permanent magnet is passed through a loop of wire. Furthermore, Lenz’s Law explained that the electromotive force (EMF) produced have different directions depending on the direction of the movement of the magnet relative to the loop of wire. Lenz’s Law also indicates that the EMF can be converted into electricity if both ends of wire are connected to electrical load and it would produce an alternating current.
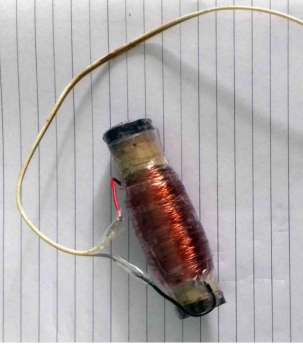
Figure 7: Shake Generator with permanent magnet sealed in the tube
From the understanding of the laws, a shake generator is made as in the figure above. The shake generator is made by using 30SWG magnet wire circling around a Perspex tube. A permanent and powerful magnet is then placed in the tube. Both end of the Perspex tube is then sealed using rubber-closed blind.
Knowing that the generator would produce alternating current and produce low voltage, a circuit is designed which combined both AC-DC Converter and 12V Output voltage regulator. The AC-DC converter only consists of four 1N4001G diode which combined to form rectifier. On the other hand, the voltage regulator is created by using the LM7812CT Fairchild Semiconductor, 0.1 μF capacitor and 10 μF capacitor.
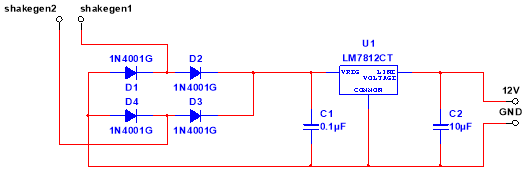
Figure 8: AC-DC Converter and 12V 2A Voltage Regulator Circuit
3.3 Battery Charging Circuit
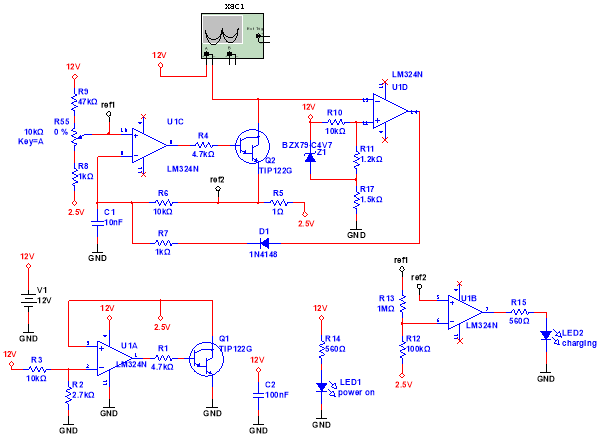
Figure 9: Battery Charging Circuit
In this circuit, a LM324N Operational Amplifier (op-amp) is used. The op-amp is used to produce a voltage and current limited power supply as in reviewed in the literature review early in this report. In this circuit, the current can be adjusted by using a potentiometer to produce current ranging from 160A to 1600mA. This allows the charger to charge various capacity of lithium ion batteries. The op-amp is used so that the voltage is limited to 4.2V. Thus, the lithium ion batteries will not be damaged.
Besides, the circuit also used the TIP122G transistors. This transistor generally is a Darlington bipolar power transistor. This transistor can actually be replaced with any transistor which have pin that compatible with TIP122G’s pin. The transistor also need to have minimum DC current gain more than 100. Besides, the maximum collector current also need to be more than 2A.
3.3.1 Power Supply of the Charger
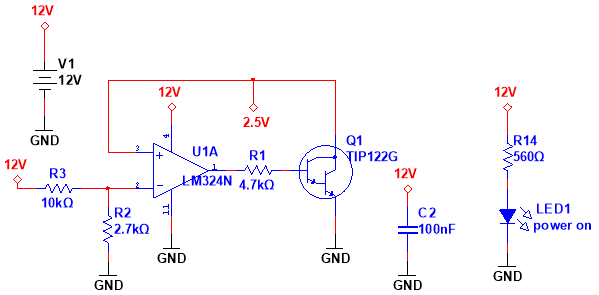
Figure 10: Power Supply Circuit of the Battery Charger
The battery charging circuit is mainly power-driven by a charger with rating of 12V 2A as designed in the Kinetic/Mechanical to Electrical Energy Converter module. It is found that the op-amp LM324N is not a rail to rail type. Thus, another voltage rail is needed so that the op-amp could detect the small voltages near the ground (GND). Besides, it is also made the output voltage to be low so that the Darlington transistor (TIP122G) wouldn’t turned on when they are not supposed to.
By referring to the overall schematic circuit of the Battery Charging Circuit, it can be seen that the transistor, that adjust the flow of the current and voltage across the lithium ion battery (illustrated by the oscilloscope), is not connected to ground but to a voltage rail. This is because the output of the LM324N op-amp couldn’t reach the negative voltage supply. It can only reach 1.5 to 2.0V. At this condition, the TIP122G Darlington transistor couldn’t be able to turn off and would result in the transistor for not be able to limit the current and voltage appropriately.
This is one of the reasons why op-amp U1A and a transistor are used. This is to create a 2.5V rail practically compared to ground (GND). The voltage rail created are further used to sink the current which pass through the charger section of this module.
From the circuit, the function of the resistor R2 and R3 are to act as potential divider which gives an average output voltage of 2.5V. However, it is still depending on the tolerance of both resistors. No matter on how the current flow, 2.5V will always loss across the op-amp which controls the transistor.
In the circuit, the LED shows whether the charger is on or off. In addition, C2 steadily adjust the voltage out from the charger. In the battery charging circuit module, all of the op-amps and the charging indicator (illustrated by the LED) are precisely powered from the 12V supply. However, the remaining of the circuit is powered with the voltage between 12V and 2.5V rails which is 9.5V.
3.3.2 The charger circuit
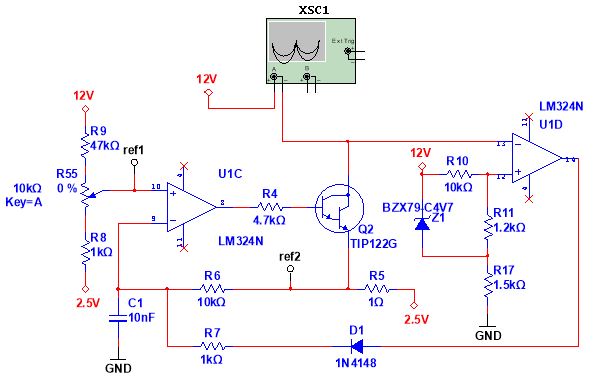
Figure 11: Actual Charger Circuit
This section is the most significant section of the charger because this is the section that responsible in restricting the voltage and current across the lithium ion battery. From the circuit, the limited current can be controlled from the 10k Ω potentiometer. However, the limited voltage will be constantly at 4.2 V unrelatedly to the various kind of the power supply.
The potentiometer also effectively works together with the U1C in limiting the current of the battery. The current passing it and the voltage across might be equal since the value of the sense resistor is only 1 Ω.
The potentiometer is above the 1k resistor and the voltage across the 1k Ω resistor is 160mV. This would make the lowest voltage of the output of the potentiometer would be 0.16V. In this condition, this circuit would produce limited current of 160mA which is a suitable condition to charge a lithium ion battery labelled with 300mAh.
The highest limited current through the potentiometer can be somewhat more than 1.6A since the voltage drop that been found across it is about 1.6V. Thus, by changing the potentiometer, the possible output voltage obtained can be around 0.16V to 1.6V. On the other hand, this also means that the highest limited current can be ranging around 1600mA to 160A.
The transistor will be driven by the op-amp to make the voltage across the sense resistor to have the equal value as in the output of the potentiometer. Besides, the op-amp might get to produce low voltage that is just sufficient to make the transistor turn off and to establish a low limited current all because of the 2.5V rail.
Towards the finale phase of the constant current stage, the voltage of the lithium ion battery become closer to the value of 4.2V. At this situation, the limiting voltage stage of the circuit and the constant voltage stage will start to take over the process.
A 4.2V situation under 12V (VCC) are created by the BZX79 4.7V Zener diode and the potential divider that consists of R10 and R11. At the moment where the voltage across the lithium ion battery get to 4.2V markings, the U1D op-amp begins to drive voltage into the reversing input of the other op-amp. This process will allow the op-amp to reduce the voltage of the output to the transistor. Thus, the current passing through the lithium ion battery will begin to fall steadily in order to maintain 4.2V across the battery.
When the lithium ion battery is being charged, which indirectly increase the internal resistance of the battery, a smaller amount of current is desired to maintain 4.2V across the battery. The battery is thought to be fully charged is only when the current passing through it get under 3 to 10% of the nominal capacity of the battery.
3.3.3 Charging Indicator

Figure 12: Charging Indicator
A battery need 2 to 4 hours to be fully charged but that are still subjected to the charge rate which is normally found to be 0.5C to 0.7C. The battery is 100% fully charged when the current that pass through the battery is below 3 to 10% of the nominal capacity. The circuit above are responsible in telling when are the battery full charged.
The U1B op-amp in this circuit is used to as comparator. The voltage across the 2.5V rail that will fall when the constant voltage (CV) stage are compared to the output voltage produced by the potentiometer.
The resistor R15 and R16 which act as a potential divider produce 9% of the voltage set. Then the inverting input of the op-amp is then fed with the reference voltage.
It is known that the voltage across the sense resistor have the same value with the current that passed through the battery. When the voltage fall lower than the reference voltage that had been set by the potential divider, the output of the op-amp jumps to ground (GND) and the LED is turned off immediately. This is happening because the voltage at the positive input of the op-amp is higher than in the negative input of the op-amp.
This set up is useful so that the LED will turn on when the battery is still charging and the LED will immediately turn off when the battery is considered to be fully charged. If the input pin of the op-amp is changed, the function of the LED will also change. This means that the LED keep being off when the battery is charging but will only turn on when the battery is fully charged.
4.1 Kinetic/Mechanical to Electrical Energy Converter
It is not quite impossible to simulate how the generator works in Multisim. However, the circuit used as the AC-DC Voltage Regulator is managed to be simulated.

Figure 13: Simulation of the AC-DC Voltage Regulator
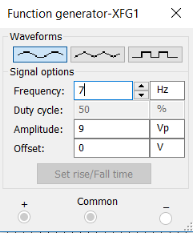
Figure 14: Function Generator replacing the shake generator
Knowing that the peak-peak voltage produced by the shake generator, the simulation used a function generator to replace the shake generator. Eventhough it is not the same, it is the closest method in achieving the same output as the shake generator. The output of the simulation which should get approximately 12V output is gained by using the oscilloscope. The result of the simulation are shown as in the graph below.
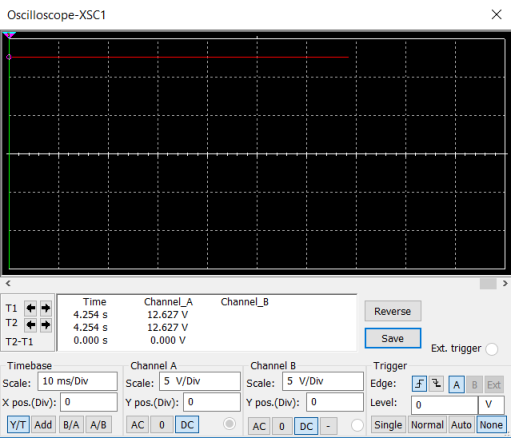
Graph 3: Result of the AC-DC Voltage regulator simulation
4.2 Battery Charging Circuit

Figure 15: Simulation of battery charging circuit
As in the charger circuit, the input is the power supply which is found to be a 12V DC source. Thus, in the simulation, the input of the charger is replaced by cells with the same voltage as the actual power supply. The output of the simulation is expected to produce low voltage which is essential for charging a lithium ion battery. The simulation of the circuit is as below:
5.1 Shake Generator
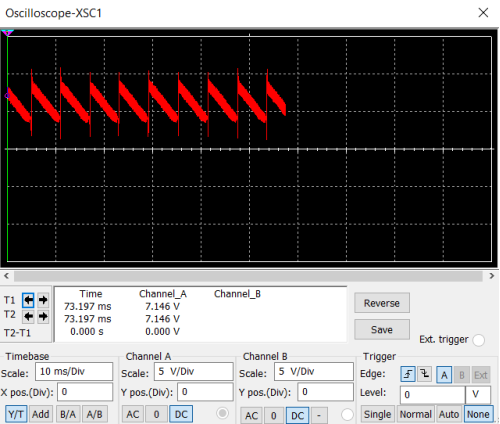
In order to test the shake generator by itself only, both ends of the wire loop is connected to the oscilloscope. It is expected to see alternating-current like signal as the direction of the EMF produced is also alternate from positive to negative.
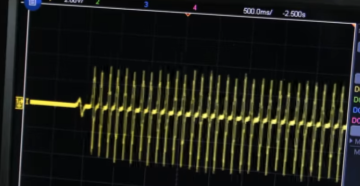
Figure 16: Oscilloscope reading of the output of the shake generator
The output of the shake generator is approximately producing 4.0V which is 8.0V peak-peak.
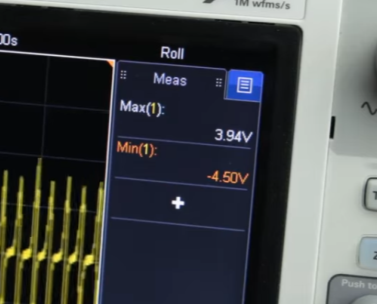
Figure 17: Voltage produced by the shake generator
The other test of the other modules still couldn’t be done at the moment as the modules need to be interpreted into hardware which is in form of Printed Board Circuit (PCB). The PCB is not readily available yet because the extraction files which is called Gerber files from the Multisim is cannot be read by the machine that does all the printing work. I have already used other software in order to extract the Gerber files yet the files could still not be read by the machine.
My future plan ahead is to get the PCB done for each modules of the system. After each of the modules shows the result as expected, the interfaces between each modules also need to be done. Only after all the interfaces shows positive result, the full assemble of the system will be done.
[1]Williams, L. Pearce , 1965. Michael Faraday: A biography. 1st Ed. New York: Basic Books Inc.
[2]Matthew N. O. Sadiku, 2006. Elements of Electromagnetics (The Oxford Series in Electrical and Computer Engineering). 4 Edition. Oxford University Press.
[3]Maxwell, James Clerk, 1904. A Treatise on Electricity and Magnetism, Vol. II. 3rd ed. Oxford: Oxford University Press
[4]Robert H. Good, 1998. Classical Electromagnetism. 1 Edition. Saunders College Publishing
[5]Jordan, E ; Balmain, K. G., 1970. Electromagnetic Waves and Radiating Systems . 2nd Ed. New Jersey: Prentice-Hall
[6]Hayt, W., 1989. Engineering Electromagnetics. 7th ed. New York: McGraw-Hill Education
[7]Ron Schmitt Former Director of Electrical Engineering Sensor Research and Development Corp. Orono Maine, 2002. Electromagnetics Explained: A Handbook for Wireless/ RF, EMC, and High-Speed Electronics (EDN Series for Design Engineers). 1 Edition. Newnes
[8]Patrick Michael Whelan, 1978. Essential Principles of Physics. 2nd Edition. John Murray
[9]Nave, C. R., Faraday’s Law,. HyperPhysics, Georgia State University, Retrieved 2011-08-29
[10]Douglas A. Skoog, 2006. Principles of Instrumental Analysis. 6 Edition. Brooks Cole
[11]Gustav Gautschi, 2013. Piezoelectric Sensorics: Force Strain Pressure Acceleration and Acoustic Emission Sensors Materials and Amplifiers. 1 Edition. Springer
[12]Erhart, JiÅ™í., May 8, 2014, Piezoelectricity and ferroelectricity: Phenomena and properties, Department of Physics, Technical University of Liberec
[13]Mason W.P., 1981, Piezoelectricity, its history and applications, J Acoust Soc Am; 70: 1561-6. Cambridge, MA, Harvard University Press.
[14]Carazo, Alfredo Vázquez, 2000, Novel Piezoelectric Transducers for High Voltage Measurements, Universitat Politècnica de Catalunya
[15]David Linden, 2001. Handbook Of Batteries. 3 Edition. McGraw-Hill Professional
[16]Balbuena, P.B., Wang, Y.X., 2004. LITHIUM-ION BATTERIES: SOLID-ELECTROLYTE INTERPHASE. Edition. ICP.
Work Packages
The following work packages for Motion-powered charger have been identified:
- WP1 Planning and organizing
WP1.1 Rough design of project
WP1.2 GANTT analysis
WP1.3 Informal specification
WP1.4 Research
WP1.5 Literature Review
- WP2 Design process
WP2.1 Initial report
WP2.2 Design
WP2.3 Hardware source and order
- WP3 Build
WP3.1 Electronic circuit of charger
WP3.2 Interface between kinetic to electrical energy with the charger circuit
WP3.3 Interface between the charger circuit with the battery
- WP4 Testing
WP4.1 No connection failure
WP4.2 No system breakdowns
WP4.3 No system failure when fully assemble
Gantt chart
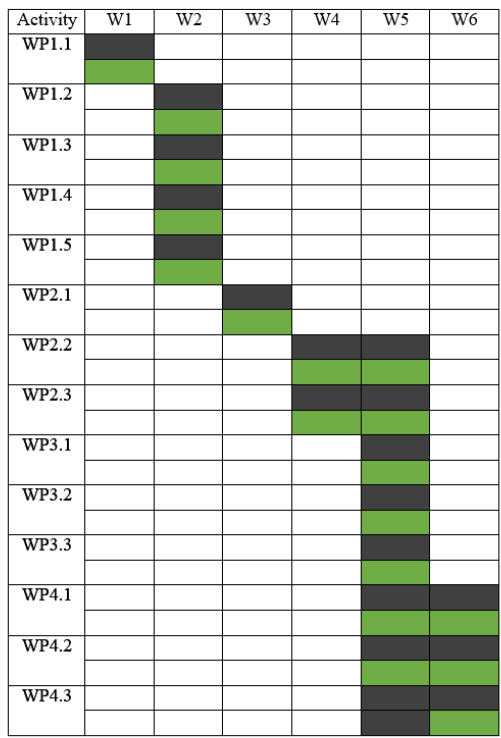
Figure 18: Gantt Chart of the Project