Optimization of Distillation Column Experiment
Optimization of distillation column in terms of energy consumption and CO2 emission
Sina Radfar[1]*
* Department of Chemical Engineering, Isfahan University of Technology, Isfahan 84156-83111, Iran
Abstract
The distillation is one of the energy consuming process in world’s process industry. Therefore, there must be approach for optimal use of energy and reduction of harmful gas emission such as CO2. The Aspen Plus “Column Targeting Tool (CTT)” options in a simulation environment can help reduce the use of energy and hence CO2 emissions. Also, the Aspen Plus “Carbon Tracking (CT)” together with the “Global Warming Potential (GWP)” options can quantify the reduction in CO2 emission. The CTT is based on the practical near minimum thermodynamic condition approximation and uses thermal and hydraulic analyses of distillation columns to identify the objects for possible column modifications. By using the “CO2 emission factor data source” and “fuel type”, the CT estimates the total CO2 emission and net carbon fee/tax on the use of a utility. In this study, by using these Aspen plus options and also using energy efficient distillation column, namely HIDiC, the way for optimization of energy consumption and CO2 emission expressed and the results compared with conventional distillation column namely RADFRAC. Finally, it was concluded that despite lower energy consumption in HIDiC, the rate of CO2 emission is twice the conventional column.
Keywords: Energy-efficient Distillation column, Column targeting tool, Column grand composite curves, Carbon tracking, Global warming potential.
Distillation is the most widely used industrial separation technology and distillation units consume a significant part of the total heating energy in the world’s process industry. The U.S. Department of Energy estimates that 40,000 distillation columns are presently in operation in the United States and consumes 4.8 quadrillion BTUs of energy – 40% of the processing energy used in refining and continuous chemical processes [1] [2]. Although distillation is by far the most widely applied separation technology, its major drawback is the inevitable reduce of energy due to the temperature difference between the reboiler and condenser; which leads to a low overall thermodynamic efficiency of a distillation column, e.g., below 10% [3]. Therefore, improving the energy efficiency of this unit operation is important to achieving energy savings of plant. Aspen Plus “Column Targeting Tool (CTT)” is based on the Practical Near-Minimum Thermodynamic Condition (PNMTC) approximation representing a practical and close to reversible operation [4]. It uses thermal and hydraulic analyses of distillation columns to identify the objects for possible column modifications in: 1) stage feed location, 2) reflux ratio, 3) feed conditioning, and 4) side condensing and/or reboiling. These modifications can reduce the utility usage and improve energy efficiency.
The “Column Targeting Tool (CTT)” option can help reduce the use of energy, while the “Carbon Tracking (CT)” and “Global Warming Potential (GWP)” options can help quantify the reduction in CO2 emission in a simulation environment. Sustainability has environmental, economic, and social dimensions and requires the responsible use of resources such as energy and reduction in CO2 emission [5]. In this study, the energy and CO2 emission as the pollutant are used as the sustainability metrics in distillation column operations. This study demonstrates how to reduce and quantify the energy consumption and CO2 emissions by using the commercial software, Aspen Plus.
2.1. Column targeting tool
A “practical near-minimum thermodynamic condition” purposes a reversible column operation at minimum reflux with appropriate heat integration and hence negligible entropy production. To achieve this, heaters and coolers with appropriate duties must be operate at each stage; so that the minimum reflux ratio would be result, and hence the operating line approaches the equilibrium curve. This would correspond to the distribution of reboiling and condensing loads throughout the column, and hence over the temperature range of the operation. The Aspen Plus column targeting tool for thermal analysis and hydraulic analysis is helpful in identifying the objects for appropriate modifications in order to reduce utility and capital costs by improving thermodynamic driving forces, improve energy efficiency, and decrease column bottlenecking. The column-targeting tool of Aspen Plus produces the enthalpy and the exergy loss profiles based on the practical near-minimum thermodynamic condition. The enthalpy estimations take into account the thermodynamic losses due to column design and operating conditions, such as pressure drop, multiple feed and side products, as well as side heat exchangers. The pinch point in distillation requires that there should be no side reboiling below the pinch and no side condensing above the pinch in heat-integrated columns [6].
The CTT can be activated by using the related option on the “Analysis / Analysis Options” sheets, as shown in Figure 1.
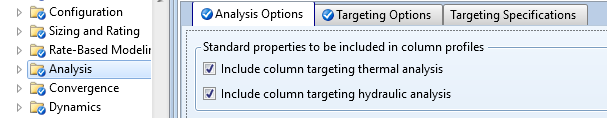
Figure 1: Analysis / Analysis Options to activate the Column Targeting Tools (CTT).
Results of the column targeting analysis depend strongly on the selection of light key and heavy key components in Targeting Options (Figure 2) [7].
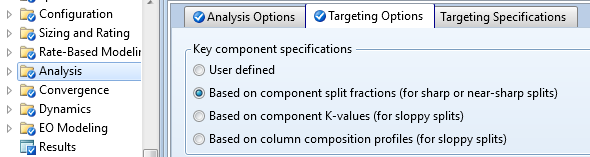
Figure 2:Â Analysis / Targeting Options with key component specification.
Before designating light key and heavy key components for the column (refer to Table 1), the user runs the simulation and considers the column split-fractions, composition profiles, and component K-values displayed by the “Plot Wizard”. In case of multiple light and heavy key, if there is more than one light key component, the heaviest of them is selected as the light key; similarly, if there is more than one heavy key component, the lightest of them is selected as the heavy key. In the default method for this study, key components are selected based on the component K-values. The CTT has a built-in capability to select light and heavy key components for each stage of the column [4] [7].
Table 1: Selection of key components within the “Targeting Options”.
|
Method |
Use When |
|
User defined |
Allows you to specify the light key and heavy key components. |
|
Based on component split fractions |
This method is best for sharp or near-sharp splits fractions in product streams. |
|
Based on component K-values |
This method is best for sloppy splits. |
|
Based on column composition profiles |
In principle, this method is similar to the K-value based method. It is best suited for sloppy splits and it is, in general, inferior to the K-value based method. |
2.2. Column Grand Composite Curve
To analyze the energy-saving potential of distillation columns, it is common to form the temperature-enthalpy and stage-enthalpy curves, called column grand composite curves. Column grand composite curves (CGCC) are based on the practical near-minimum thermodynamic condition approximation proposed by Dhole and Linnhoff [8] [9], and show the theoretical minimum heating and cooling duties within the temperature range. The stage-enthalpy calculations take into account losses or inefficiencies caused by the actual column design, such as pressure drops, multiple side products, etc. Column grand composite curves display the net enthalpies for the actual and ideal operations at each stage, and the cold and hot utility requirements. Therefore, the area between the actual and the ideal operations in a column grand composite curve should be small for a thermodynamically efficient operation. Column grand composite curves are formed by solving the mass and energy balances for a reversible column operation.
Simulation packages such as Aspen Plus are making column grand composite curves readily available even for multicomponent, complex distillation column operations such as crude oil distillation. These simulators enable the process engineer to assess the performance of an existing operation and explore the possibility of reducing utility costs by improving efficiency in energy usage. Column grand composite curves can identify targets for restructuring and modification, and may be helpful in suggesting retrofits. Some of the retrofits consist of feed conditioning (preheating or precooling), feed splitting, reflux adjustments, and adding side condensers and reboilers. These retrofits purpose a practical near-minimum thermodynamic loss [6].
2.3. Thermal analyses
Thermal analysis ability is useful in identifying design objects for enhancements in energy consumption and efficiency [8] [10] [11]. In this ability, the reboiling and condensing loads are distributed over the temperature range of operation of the column. The thermal analysis of CTT produces “Column Grand Composite Curves” and “Exergy Lost Profiles”. The user makes changes to column specifications until the profiles look right based on the column targeting methodology. The CGCCs are displayed as the stage-enthalpy (S-H) or temperature-enthalpy (T-H) profiles. They represent the theoretical minimum heating and cooling requirements over the stage or temperature range of separation. This approximation takes into account the inefficiencies introduced through column design and operation, such as pressure drops, multiple side-products, and side strippers.
Using the equilibrium compositions of light (L) and heavy (H) key components obtained from a converged simulation, we estimate the minimum vapor and liquid flow rates leaving the same stage with the same temperatures from the following mass balances:
|
|
(1) |
|
|
(2) |


where  and
and  are the equilibrium mole fractions of liquid and vapor streams,
  and
and  the minimum amounts of the liquid and vapor streams, and
  the distillate. The enthalpies for the minimum vapor and liquid flows are obtained from the molar flow ratios
|
|
(3) |
|
|
(4) |


where  and
and  are the molar flows of equilibrium,
  and
and  the enthalpies of equilibrium vapor and liquid streams leaving the same stage, respectively. From the enthalpy balances at each stage, the net enthalpy deficits are obtained
|
|
(5) |
|
|
(6) |
 Â Â Â (before the feed stage)
   (before the feed stage)    (after the feed stage)
   After adding the individual stage-enthalpy deficits to the condenser duty, the enthalpy values are cascaded, and plotted in column grand composite curves. This is called the top-down calculation procedure, which will be the same as the bottom-up calculations for a stage without any feed. At the feed stage, mass and energy balances differ from a stage without feed, and finite changes of composition and temperature disturb the reversible operation. For the two procedures to yield similar results, the enthalpy deficit at the feed stage becomes
|
|
(7) |

The values of  and
and  may be obtained from an adiabatic flash for a single phase feed, or from the constant relative volatility estimated with the converged compositions at the feed stage and feed quality. This procedure can be reformulated for multiple feeds and side products as well as different key components. A pinch point near the feed stage occurs for nearly all binary ideal mixtures. However, for nonideal multicomponent systems, the pinch point exists in rectifying
and stripping sections.
A horizontal distance between the column grand composite curve pinch point and the vertical axis represents excess heat, and therefore the scope for reduction in reflux ratio. For smaller reflux ratios, the column grand composite curve will move toward the vertical axis, and hence reduce the reboiler and condenser duties, which may be estimated by
|
|
(8) |

where  is the heat of vaporization. The horizontal distance of the column grand composite curve from the temperature axis determines the targets for installing a side reboiler or side condenser at suitable temperatures (or stages). On the other hand, a sharp change in the enthalpy represents inappropriate feed conditioning, such as poor feed quality or nonoptimal temperature. For example, a sharp change on the reboiler side may be due to a subcooled feed, and a feed preheater can be installed. Feed conditioning is usually preferred to side condensing or reboiling, since the side heat exchangers are effective at suitable temperature levels only.
Exergy ( ) is defined the maximum amount of work that may be performed theoretically by bringing a resource into equilibrium with its surrounding through a reversible process.
|
|
(9) |

where  and
and  are the enthalpy and entropy, respectively, and
  is the reference temperature, which is usually assumed as the environmental temperature of 298.15 K. A part of accessible work potential is always lost in any real process. Exergy losses represent inefficient use of available energy due to irreversibility, and should be reduced by suitable modifications [8]. Exergy balance for a steady state system is
|
|
(10) |

where  is the shaft work. As the exergy loss increases, the net heat duty has to increase to enable the column to achieve a required separation. Consequently, smaller exergy loss means less waste energy. The exergy profiles are plotted as stage-exergy loss or temperature-exergy loss. In general, the exergy loss profiles can be used as a tool to examine the degradation of accessible work due to [7] [8]:
- Momentum loss (pressure driving force)
- Thermal loss (temperature driving force)
- Chemical potential loss (mass transfer driving force)
2.4. Hydraulic analysis
Hydraulic analysis helps identify the allowable limit for vapor flooding on the “Tray Rating Design/ Pressure drop” or “Pack Rating Design/Pressure drop” sheets. Tray or packing rating information for the entire column is necessary to activate the hydraulic analysis. In addition, allowable flooding factors (as fraction of total flooding) for flooding limit calculations can be specified. The default values are 85% for the vapor flooding limit and 50% for the liquid flooding limit. The liquid flooding limit specification is available only if the downcomer geometry is specified. The allowable limit for liquid flooding (due to downcomer backup) can be specified on the “Tray Rating/Downcomers” sheet [7]. The hydraulic analysis ability helps understand how the vapor and liquid flow rates in a column compare with the minimum (corresponding to the PNMTC) and maximum (corresponding to flooding) limits. For packed and tray columns, jet flooding controls the calculation of vapor flooding limits. For tray columns, parameters such as downcomer backup control the liquid flooding limits. Hydraulic analysis produces plots for flow rates versus stage and can be used to identify and eliminate column bottlenecks [7]. Graphical and tabular profiles (Figure 3 and Figure 4) help identifying targets and analysis for possible modifications by the user.
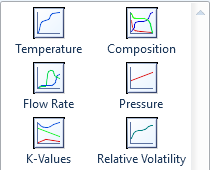
The “Plot Wizard” (Figure 4) produces various plots including the types:
- Thermal analysis: The CGCC (T-H) Temperature versus Enthalpy
- Thermal analysis: The CGCC (S-H) Stage versus Enthalpy
- Exergy loss profiles: Stage versus Exergy loss or Temperature versus Exergy loss
- Hydraulics analysis: Thermodynamic Ideal Minimum Flow, Hydraulic Maximum Flow, Actual Flow
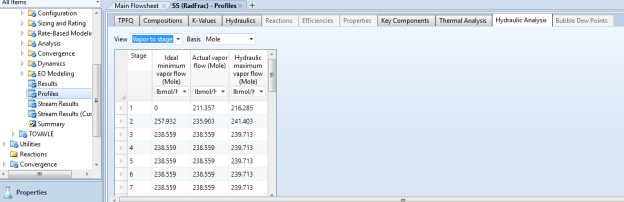
Figure 3: Tabular profile for hydraulic analysis.
 Â Â Â Â Â
Figure 4: Plot Wizard displays several plots as a part of “Analysis” and “Column Targeting Tool”.
2.5. Heat-Integrated Distillation Column (HIDiC)
As distillation is one of the most energy-intensive units in chemical process industries, many efforts have been focused on the development of distillation systems and distillation equipment in order to improve its energy efficiency. Many complex distillation configurations have been studied and proposed to improve the energy efficiency. For example, the dividing-wall distillation column or the Petlyuk column is a complex distillation scheme which has been successfully commercialized after several decades of research.
More recently, another distillation scheme called the internally heat-integrated distillation column (HIDiC) has received extensive attention. Unlike the Petlyuk column, the key idea of the HIDiC leading to considerable energy savings is the combination of direct vapor recompression scheme (VRC) and the heat integration between two diabatic sections. The diabatic section is a column section which allows heat transfer to enter or leave its stages. Its’ purpose is to distribute exergy loss from the main condenser or reboiler to all stages in the section, hence reducing the main utility load and the overall exergy loss of the section. If two diabatic sections with opposite directions of heat transfer are integrated, the energy requirement along both sections can then be saved. As shown in Figure 5a, the rectifying and the stripping sections are separated by the feed tray. Instead of having heat rejection only through the main condenser and heat supply through the main reboiler, the total heat rejection is distributed along the rectifying section, while the stripping section absorbs this amount of heat with similar distribution along the column. A compressor and a throttling valve are used to manipulate the pressure difference between both column sections. The rectifying pressure must be sufficiently high to provide a positive temperature driving force between both sections for feasible heat transfer along the columns. This internal heat integration between column sections can be achieved using a heat transfer equipment such as heat pipes at any stage location. The design without any thermal utility (as in Figure 5a) is called the ideal HIDiC. This scheme requires only electricity or mechanical power for compressor. However, a trim-condenser and/or trim-reboiler may be installed at the top of the rectifying and/or the bottom of the stripping sections, respectively, to enhance the process operational flexibility. The general HIDiC scheme with any trim-condenser and/or trim-reboiler is known as the internally heat-integrated distillation column (Figure 5b) [12].
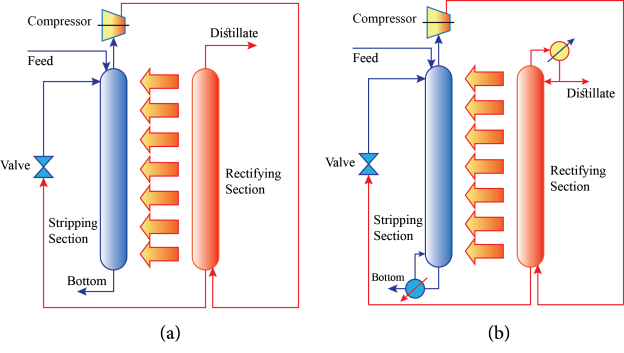
Figure 5: The ideal HIDiC (a) and the internally heat-integrated distillation column (b).
2.6. Sustainability metrics
2.6.1. Potential environmental impact
This study quantifies the sustainability metrics of “potential environmental impacts”, which is the emissions per unit mass of product and carbon tax, by using the Aspen Plus options of (1) “Carbon Tracking (CT)” and (2) “Global Warming Potential (GWP)”.
Carbon tracking: In each utility block, “carbon tracking” allows the calculation of CO2 emissions after specifying “CO2 emission factor data source” and “ultimate fuel source” from built-in data. The CO2 emission factor data source can be from “European Commission decision of 2007/589/EC” or “United States Environmental Protection Agency Rule of E9-5711” [13] [14]. This source can also be directly specified by the user. In this example, CO2 emission factor data source is US-EPA-Rule-E9-5711 and the fuel source is natural gas as seen in (Figure 6). The utilities used in the column include cooling water and steam. The “Results Summary / Operating Costs / Utility Cost Summary” sheet displays the total heating and cooling duties as well as their costs. The rate and cost of CO2 emission results would be available within the “Results Summary / CO2 Emissions”.
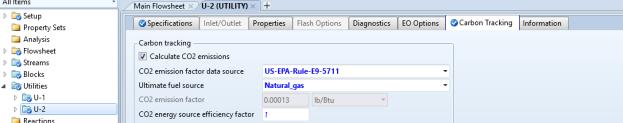
Figure 6: Utilities / U-2 / Input / Carbon Tracking / Calculate CO2 emissions.
Global warming potential: Aspen Plus reports greenhouse gas emissions in terms of CO2 equivalents of “Global Warming Potential (GWP)”. CO2 is one of the greenhouse gases that cause around 20% of GWP. To use this feature one can create a property set. Prop-Set properties report the carbon equivalents of streams based on data from three popular standards for reporting such emissions: 1) the IPCC’s 2nd (SAR), 2) 4th (AR4) Assessment Reports, and 3) the U.S. EPA’s (CO2E-US) proposed rules from 2009 (Table 2) [13] [14]. Prop-Set properties are reported in stream reports after selected: Report Options / Streams / Property sets. The “Setup / Calculation Options / Calculations” sheet activates the standards for “Global Warming Potential” as well as “Carbon fee/tax” which set as “USEPA (2009)” and “5 $/lb”, respectively. The “Results” sheet of each “Utility” block displays the CO2 equivalents emitted by this utility in each unit operation block where it is used.
Table 2: Standards for reporting CO2 emissions.
|
Standards for reporting CO2 emissions |
Prop-Set properties corresponding to each standard |
|
IPCC SAR (1995) |
CO2E-SAR |
|
IPCC AR4 (2007) |
CO2E-AR4 |
|
USEPA (2009) |
CO2E-US |
2.6.2. Energy intensity
This study calculates the sustainability metrics “Energy intensity” as nonrenewable energy per unit mass of products by using the Aspen plus Column Targeting Tool abilities of “Thermal Analysis” and “Hydraulic Analysis”.
2.7. Methods for optimization
2.7.1. Modifying the feed stage location
In Aspen Plus, the condenser is the first stage, while the reboiler is the last stage. The S-H plots of CGCC can identify distortions because of inappropriate feed placements. The distortions become apparent as significant projections at the feed location called the pinch point due to a need for extra local reflux to compensate for inappropriate feed placement. A correctly introduced feed removes the distortions and reduces the condenser and reboiler duties.
- If a feed is introduced too high up in the column, a sharp enthalpy change occurs on the condenser side on the S-H CGCC plot; the feed stage should be moved down the column.
- If a feed is introduced too low in the column, a sharp enthalpy change occurs on the reboiler side on the S-H CGCC; the feed stage should be moved up the column [10].
2.7.2. Modifying the reflux ratio
The horizontal gap between the T-H CGGC pinch point and the ordinate represents the excess heat, and therefore, the scope for a reduction in reflux ratio [7]. As the reflux ratio is reduced, the CGCC will move towards the ordinate and hence reduce both the reboiler and condenser duties. However, to preserve the separation, the number of stages must increase.
2.7.3. Feed conditioning
The need for an adjustment of feed quality can be identified from sharp enthalpy changes on the S-H or T-H CGCC plots.
- If a feed is excessively sub-cooled, the T-H CGCC plot will show a sharp enthalpy changes on the reboiler side, and extent of this change determines the approximate feed heating duty required.
- If a feed is excessively over-heated, the T-H CGCC plot will show a sharp enthalpy changes on the condenser side, and extent of this change determines the approximate feed cooling duty required.
- Changes in the heat duty of pre-heaters or pre-coolers will lead to similar duty changes in the column reboiler or condenser loads, respectively.
2.7.4. Side condensing or side reboiling
Feed conditioning is usually preferred to side condensing or side reboiling. Side condensing or side reboiling is external modification at a convenient temperature level. The scope for side condensing or side reboiling can be identified from the area below and/or above the CGCC pinch point (area between the ideal and actual enthalpy profiles). This area could be reduced by integrating side condensing and/or reboiling on an appropriate stage [15]. If a significant area exists above the pinch, a side reboiler can be placed at a convenient temperature level. This allows heat supply to the column using a low-cost hot utility, hence lowering the overall operating costs. If a significant area exists below the pinch, a side condenser can be placed at a convenient temperature level. This allows heat removal from the column more effectively and by a cheaper cold utility, hence lowering the overall operating costs.
Use of side condensing or reboiling cause increasing of a condenser and reboiler duties, an increase of CO2 emission, and an increase of costs (due to installing heat exchanger). Therefore, should be careful of using this.
By using maintained above methods, CGCC plots achieved. Referring to these plots, optimal condition is where ideal and actual plots are overlapping (for S-H and V-S plots) or minimum exergy loss is obtaining (for S-E plot). Therefore, modifying conditions (such as feed stage location, reflux ratio, feed conditioning, and side condensing/reboiling duty) continued until overlapping or minimizing achieved. In the following, schematic of simulations and input data along with their results are coming.
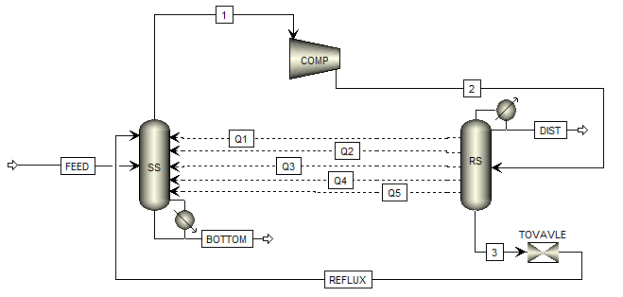
Figure 7: Simulation of HIDiC configuration.
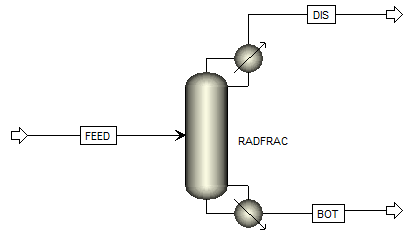
Figure 8: Simulation of RADFRAC configuration.
Table 3: Input data for HIDiC configuration.
|
Components |
Benzene / Toluene / Water |
|
Base Method |
RK-SOAVE |
|
Feed Stream Conditions |
Temperature = 343.15 K, Pressure = 1 MPa |
|
Feed Stream Mole Flow [mol fraction] |
Benzene = 0.5, Toluene = 0.5 |
|
RADFRAC Block Configurations |
Number of stage = 28, Condenser = Partial-Vapor, Feed stage for SS = 3, Reflux stage = 2, Feed stage for RS = 14, Condenser pressure for SS = 0.1013 MPa, Condenser pressure for RS = 0.2026 MPa, Reflux ratio for SS = 2.5 mole, Reflux ratio for RS = 6.06 mole, Distillate to feed ratio = 0.226 mole |
|
Compressor Configurations |
Type: Positive displacement, Discharge pressure = 0.3 MPa, Mechanical efficiencies = 1 |
|
Throttling valve Configurations |
Temperature = 343.15 K, Pressure = 0.15 MPa |
|
Tray Sizing |
Starting stage = 2, Ending stage = 27, Tray type = Sieve |
|
Tray Rating |
Starting stage = 2, Ending stage = 27 Tray type = Sieve, Diameter of SS = 0.8 m, Hole diameter of SS = 0.025 m, Diameter of RS = 0.45 m, Hole diameter of RS = 0.028 m |
|
Condenser Utility (CW) |
Utility type = water, Purchase price = 0.05 $/ton, Pressure inlet and outlet = 0.024 MPa, Temperature inlet = 76.25 K, Temperature outlet = 114.4 K |
|
Reboiler Utility (STEAM) |
Utility type = steam, Purchase price = 6 $/ton, Heating/Cooling value = 850 Btu/lb, CO2 emission factor data source = US-EPA-Rule-E9-5711, Ultimate fuel source = Natural gas |
|
Heaters Coolers |
Heat Streams = 5-10-15-20-25, Side Duties = 13/-1000/U-1, 18/800/U-2 |
Table 4: Input data for RADFRAC configuration.
|
Components |
Benzene / Toluene / Water |
|
Base Method |
RK-SOAVE |
|
Feed Stream Conditions |
Temperature = 343.15 K, Pressure = 1 MPa |
|
Feed Stream Mole Flow [mol fraction] |
Benzene = 0.5, Toluene = 0.5 |
|
RADFRAC Block Configurations |
Number of stage = 28, Condenser = Partial-Vapor, Feed stage = 14, Condenser pressure = 0.2 MPa, Reflux ratio = 4 mole, Distillate to feed ratio = 0.226 mole |
|
Tray Sizing |
Starting stage = 2, Ending stage = 27, Tray type = Sieve |
|
Tray Rating |
Starting stage = 2, Ending stage = 27 Tray type = Sieve, Diameter = 0.6 m |
|
Condenser Utility (CW) |
Utility type = water, Purchase price = 0.05 $/ton, Pressure inlet and outlet = 0.024 MPa, Temperature inlet = 76.25 K, Temperature outlet = 114.4 K |
|
Reboiler Utility (STEAM) |
Utility type = steam, Purchase price = 6 $/ton, Heating/Cooling value = 850 Btu/lb, CO2 emission factor data source = US-EPA-Rule-E9-5711, Ultimate fuel source = Natural gas |
|
Heaters Coolers |
Heat Streams = 5-10-15-20-25, Side Duties = 13/-1000/U-1, 18/800/U-2 |
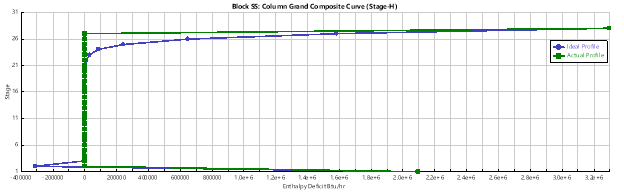
Figure 9: Stage-Enthalpy plot (for thermal analysis).
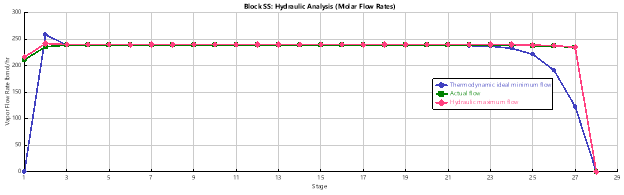
Figure 10: Vapor flow rate – Stage plot (for hydraulic analysis).
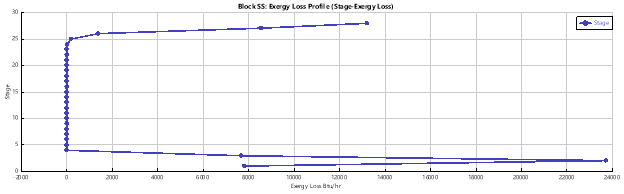
Figure 11: Stage – Exergy loss plot (for exergy analysis).
Table 5: Rate of energy consumption for HIDiC.
|
3.29 Ã- 106 |
Btu/hr |
Reboiler duty |
|
-1.23 Ã- 106 |
Btu/hr |
Condenser duty |
Table 6: Rate of CO2 emission for HIDiC.
|
0.208 |
lb/hr |
Utility CO2 emission |
|
0.208 |
lb/hr |
Total CO2 emission |
|
1.04 |
$/hr |
Net carbon fee / tax |
Table 7: Rate of energy consumption for RADFRAC.
|
1.79 Ã- 107 |
Btu/hr |
Reboiler duty |
|
-1.16 Ã- 107 |
Btu/hr |
Condenser duty |
Table 8: Rate of CO2 emission for RADFRAC.
|
0.104 |
lb/hr |
Utility CO2 emission |
|
0.104 |
lb/hr |
Total CO2 emission |
|
0.00026 |
$/hr |
Net carbon fee / tax |
As can be seen, reboiler and condenser duty in HIDiC than RADFRAC has been reducing by 81.62% and 89.40%, respectively. However, CO2 emission in HIDiC than RADFRAC has been encountered with a twice increase. This indicates that despite energy-efficient behavior in HIDiC, its’ CO2 emission is still alarming.
This study demonstrates a conceptual design tool of the Aspen Plus simulator for sustainable operation of distillation columns, which are highly energy intensive and an important part of chemical and petrochemical process industries. The “Column Targeting Tool (CTT)” can help reduce the use of energy and hence CO2 emission. The “Carbon Tracking (CT)” and “Global Warming Potential (GWP)” options can help quantify the reduction in CO2 emission. They can be part of sustainability metrics of “Energy intensity” and “Potential environmental impact” for existing and new design of distillation column operations. This study showed that by using Aspen Plus options and modifying in column operating conditions (such as feed stage location, reflux ratio, feed conditioning, and side condensing/reboiling duty), optimization the rate of energy consumption and CO2 emission can be achieved. In future, by combining pinch, integration, and exergy analysis in a simulation environment, can make this optimization more powerful and more precise.
|
[1] |
D. Ozokwelu, “Distillation Column Modeling Tools,” U.S. Department of Energy, Washington, DC, 2001. |
|
[2] |
D. C. White, “Optimize Energy Use in Distillation,” CEP, pp. 35-41, 2012. |
|
[3] |
A. A. Kiss and Z. Olujic, “A review on process intensification in internally heat-integrated distillation columns,” Chemical Engineering and Processing, vol. 86, pp. 125-144, 2014. |
|
[4] |
Y. Demirel, “Sustainable Operations for Distillation Columns,” Chemical Engineering & Process Techniques, vol. I, no. 1005, pp. 1-15, 2013. |
|
[5] |
A. A. Martins, T. M. Mata, C. A. V. Costa and S. K. Sikdar, “Framework for Sustainability Metrics,” Industrial & Engineering Chemistry Research, no. 46, pp. 2962-2973, 2007. |
|
[6] |
Y. Demirel, “Using the second law: Thermodynamic analysis,” in Nonequilibrium Thermodynamics: Transport and Rate Processes in Physical, Chemical and Biological Systems, Amsterdam, Elsevier, 2007, pp. 155-274. |
|
[7] |
Aspen Technology, 2013. |
|
[8] |
V. R. Dhole and B. Linnhoff, “Distillation Column Targets,” Computers & Chemical Engineering, vol. 17, no. 5-6, pp. 549-560, 1993. |
|
[9] |
V. R. Dhole and B. Linnhoff, “Overall Design of Low Temperature Processes,” Computers & Chemical Engineering, vol. 18, pp. S105-S111, 1994. |
|
[10] |
S.Bandyopadhyay, R. K. Malik and U. V. Shenoy, “Temperature-enthalpy curve for energy targeting of distillation columns,” Computers & Chemical Engineering, vol. 22, no. 12, pp. 1733-1744, 1998. |
|
[11] |
R. Rivero, M. Garcia and J. Urquiza, “Simulation, exergy analysis and application of diabatic distillation to a tertiary amyl methyl ether production unit of a crude oil refinery,” Energy, vol. 29, pp. 467-489, 2004. |
|
[12] |
B. Suphanit, “Design of internally heat-integrated distillation column (HIDiC): Uniform heat transfer area versus uniform heat distribution,” Energy, vol. 35, pp. 1505-1514, 2010. |
|
[13] |
“European Commission Decision 2007/589/EC,” Official Journal of the European Commision, 2007. |
|
[14] |
“United States Environmental Protection Agency Rule E9-5711,” Proposed Rules, vol. 74, no. 68, pp. 16639-16641, 10 April 2009. |
|
[15] |
Y. Demirel, “Exergy analysis of distillation columns,” International Journal of Exergy, vol. 3, pp. 345-361, 2006. |
[1] Corresponding author. Email address: [email protected]