P300-based Brain-Computer Interface Performance Enhancement
Enhancing Performance and Bitrates in a P300-based Brain-Computer Interface for Disabled Subjects by Phase-to-Amplitude Cross-Frequency Coupling
Stavros I.Dimitriadis1,2*, Avraam D. Marimpis3
1Institute of Psychological Medicine and Clinical Neurosciences, Cardiff University School of Medicine, Cardiff, UK
2Cardiff University Brain Research Imaging Center, School of Psychology, Cardiff University, Cardiff, UK
3Brain Innovation B.V., Netherlands
Abstract
A brain-computer interface (BCI) is a communication system that transforms brain-activity into specific commands for managing a computer or other home or electrical devices. In other words, a BCI is an alternative way of interacting with the environment by using brain-activity instead of muscles and nerves. For that reason, BCI systems are of high clinical value for targeted populations suffering from neurological disorders. In this paper, we present a new processing approach of a well-known P300-BCI system for disabled subjects. Estimating cross-frequency coupling (CFC) and namely δ-θ phase-to-amplitude coupling (PAC) within sensor, we succeeded high classification accuracy and high bitrates for both disabled and able-bodied subjects. The system is tested with four severely disabled and four able-bodied subjects. The bitrates obtained for both the disabled and able-bodied subjects reached the fastest reported level of 10 bits/sec. The new preprocessing approach based on recordings from the single-sensor Pz while the classification accuracy is tested also for others electrodes.
Keywords: Brain-computer interface; P300; Disabled subjects; cross-frequency coupling; accuracy
*Corresponding author:
Dr.Dimitriadis Stavros
Research Fellow
School of Medicine,
Cardiff University, UK
CUBRIC Neuroimaging Center, Cardiff,UK
- Introduction
From the very first work of Farwell and Donchin [1] the majority of P300-based Brain Computer Interface (BCI) systems focused on developing new application scenarios [2,3], and on developing and testing new algorithms for the reliable detection of the P300 waveform from noisy datasets [4-8]. For a review of P300, an interested can read the [9-10].
Ten years ago, two pioneer studies have been first published presenting a P300 BCI system on disabled subjects. Piccione et al. (2006) [11] design a 2D cursor BCI control system where subjects had to concentrate on four arrows flashing every 2.5 sec in random order occupied the peripheral area of a computer screen. Five disabled and seven able-bodied subjects were participated on this experiment. For controlling this cursor, this four-choice P300 flashing ‘arrow’ cursor was used. EEG signals were recorded using four EEG sensors and electro-oculogram. Using independent component analysis and neural networks, Piccione et al. [11] demonstrated that P300 can be a valuable control signal for disabled subjects. However, the communication system was too low compared to state of the art systems [5,8].
Sellers and Donchin (2006) [12] designed a four choice BCI experiment with four stimuli (‘YES’, ‘NO’, ‘PASS’, ‘END’) that were presented every 1.4 s in random order, in two different modalities either visual or auditory or in a combined mode. Three subjects suffering with ALS and three able-bodied subjects performed the experiment. EEG recordings from three sensors were classified using a stepwise linear discriminant algorithm (LDA). They demonstrated that communication via a P300 system is possible for subjects suffering from ALS. Additionally, they demonstrated that communication is possible in different modalities like the visual, auditory, and also in a combined auditory-visual mode. However, both the classification accuracy and the communication rate were low compared to the state of the art results. One of possible explanations of low accuracy and communication rate could be the low number of EEG sensors, the long inter-stimulus intervals and the low number of trials.
McCane et al., demonstrated a BCI system where both accuracy and communication rate did not differ significantly between ALS users and HVs. Although ERP morphology was similar for the two groups, the target ERPs differed significantly in the location and amplitude of the late positivity (P300), the amplitude of the early negativity (N200), and the latency of the late negativity (LN) [13].
Hoffmann et al.,, demonstrated a six-choice P300 paradigm which was tested in a population of five disabled and four able-bodied subjects. Six different images were flashed in random order with an ISI of 400 ms [7]. They tested how the electrode configuration can influence the accuracy in order to detect the best channel selection. For four out of five disabled subjects and for all the able-bodied subjects both the communication rates and the classification accuracies were higher compared to the aforementioned studies [11,12]. The datasets in Hoffmann et al., study can be freely downloaded from the website of the EPFL BCI group ().
In the present study, we used the dataset from Hoffmann et al., study to demonstrate an alternative algorithmic approach with main scope to improve the bitrates up to the limits. For that occasion, we adopted a cross-frequency coupling (CFC) estimator namely phase-to-amplitude coupling (PAC) to quantify how the phase of the lower frequency brain rhythms modulates the amplitude of the higher oscillations. The whole approach was followed in a trial basis and within sensors located over parieto-occipital brain areas. PAC proved to be a valuable estimator in many applications like the design of a biomarker: for amnestic mild cognitive impairment subjects during an auditory oddball paradigm [14], for dyslexia [15], for mild traumatic brain injury [16].
The layout of the paper is as follows. In Section 2, we described the subject population, the experiments that were performed, and the methods used for data pre-processing steps of the proposed pipeline and the classification procedure. Results are presented in Section 3. Discussion is devoted in Section 4.
2. Materials and Methods
2.1. Experimental setup
Users were facing a laptop screen on which six images were displayed (see Fig. 1). The images showed a television, a telephone, a lamp, a door, a window and a radio. The images were selected according to an application scenario in which users can control electrical appliances via a BCI system. The application scenario served however only as an example and was not pursued in further detail. The images were flashed in random sequences, one image at a time. Each flash of an image lasted for 100 ms and during the following 300 ms none of the images was flashed, i.e. the inter-stimulus-interval was 400 ms.
The EEG was recorded at 2048 Hz sampling rate from 32 electrodes placed at the standard positions of the 10-20 international system. A Biosemi Active Two amplifier was used for amplification and analog to digital conversion of the EEG signals.
[Figure 1 around here]
2.2. Subjects
The proposed methodology was applied to P300 BCI-oriented recordings derived from five disabled and four healthy subjects. The demographics of the four disabled are presented in (Table 1). Disabled subject 5 as excluded from further analysis. Subjects 6-9 were Ph.D. students that were recruited from EPFL BCI group’s laboratory (all males, age 30±2.3). None of subjects 6-9 had known neurological deficits. For more information regarding the subjects, an interested reader should refer to the original paper [7].
Table 1. Subjects from which data was recorded in the study of the environment control system
|
S1 |
S2 |
S3 |
S4 |
|
|
Diagnosis |
Cerebral palsy |
Multiple sclerosis |
Late-stage amyotrophic lateral sclerosis |
Traumatic brain and spinal-cord injury, C4 level |
|
Age |
56 |
51 |
47 |
33 |
|
Age at illness onset |
0 (perinatal) |
37 |
39 |
27 |
|
sSex |
M |
M |
M |
F |
|
Speech production |
Mild dysarthria |
Mild dysarthria |
Severe dysarthria |
Mild dysarthria |
|
Limb muscle control |
Weak |
Weak |
Very Weak |
Weak |
|
Respiration control |
Normal |
Normal |
Weak |
Normal |
|
Voluntary eye movement |
Normal |
Mild nystagmus |
Normal |
Normal |
2.3. Experimental schedule
Each subject completed four recording sessions. The first two sessions were performed on one day and the last two sessions on another day. All subjects were recruited within maximum two weeks between the first and the last session. Each of the sessions consisted of six runs, one run for each of the six images. For further details about the protocol followed on this experiment see the original paper related to this dataset [7].
The following protocol was used in each of the runs.
(i) Subjects were asked to count silently how often a prescribed image was flashed (for example: “Now please count how often the image with the television is flashed”).
(ii) The six images were displayed on the screen and a warning tone was issued.
(iii) Four seconds after the warning tone, a random sequence of flashes was started and the EEG was recorded. The sequence of flashes was block-randomized, this means that after six flashes each image was flashed once, after twelve flashes each image was flashed twice, etc. The number of blocks was chosen randomly between 20 and 25. On average 22.5 blocks of six flashes were displayed in one run, i.e. one run consisted on average of 22.5 target (P300) trials and 22.5Ã-5 = 112.5 non-target (non-P300) trials.
(iv) In the second, third, and fourth session the target image was inferred from the EEG with a simple classifier. At the end of each run the image inferred by the classification algorithm was flashed five times to give feedback to the user.
(v) After each run subjects were asked what their counting result was. This was done in order to monitor performance of the subjects.
The duration of one run was approximately one minute and the duration of one session including setup of electrodes and short breaks between runs was approximately 30 min. One session comprised on average 810 trials, and the whole data for one subject consisted on average of 3240 trials.
2.4 Offline Analysis
The impact of different single-sensor recordings on classification accuracy was tested in an offline procedure. For each subject four-fold cross-validation was used to estimate average classification accuracy. More specifically, the data from three recording sessions were used to train a classifier and the data from the left-out session was used for validation. This procedure was repeated four times so each session served once for validation.
2.4.1. Preprocessing
Before learning a classification function and before validation, several preprocessing operations were applied to the data.
The preprocessing operations were applied in the order stated below.
- Referencing. The average signal from the two mastoid electrodes was used for referencing.
- Filtering. A third order forward-backward Butterworth bandpass filter was used to filter the data.. The MATLAB function butter was used to compute the filter coefficients and the function filtfilt was used for filtering. The predefined frequencies were : δ {0.5-4 Hz},θ {4-8 Hz},α1 {8-10 Hz}, α2 {10-13 Hz},β1 {13-20 Hz},β2 {20-30 Hz} and γ1 {30 – 45 Hz}.
- (iii) Downsampling. The EEG was down-sampled from 2048 Hz to 512 Hz by selecting each 4th sample from the bandpass-filtered data.
(iv) Single trial extraction. Single trials of duration 1000 ms were extracted from the data. Single trials started at stimulus onset, i.e. at the beginning of the intensification of an image, and ended 1000 ms after stimulus onset. Due to the ISI of 400 ms, the last 600 ms of each trial were overlapping with the first 600 ms of the following trial.
(v) Electrode selection. We applied our analysis to recordings from single-sensor activity and mainly, PZ,OZ,P3,P4,P7 and P8.
(vi) Feature vector construction. As appropriate feature for each trial, we used the phase-to-amplitude coupling (PAC) which already has been shown its potentiality in building reliable biomarkers (Dimitriadis et al., 2015,2016). PAC was estimated for each frequency pair (see ii)). The description of PAC is given in the next section. As a complementary feature that can separate the counted stimuli from the non counted stimuli, alpha relative signal powers have been estimated. Alpha power level can give us a valuable and objective criterion when a subject attends or not attends to the stimulus. Our idea is to create an initial binary classifier that will cut-off the attended from the non-attended stimuli for each subject prior entering the main multi-class classifier.
- CFC metric computation
- CFC estimates the strength of pairwise interactions and identifies the prominent interacting pair of frequencies, both between and within sensors [17-19]. Among available CFC descriptors, phase-amplitude coupling (PAC), which relies on phase coherence, is the one most commonly encountered in research [20]. The PAC algorithm as adapted to continuous MEG multichannel recordings is described below.
- Τhe within-sensor CFC version is described. Let x(isensor, t), be the EEG activity recorder at the isensor-th site, and t=1, 2,…. T the successive time points. Given a frequency-limited signals x(isensor,t) , cross-frequency coupling is estimated by allowing the phase of the lower frequency (LF) oscillations to modulate the amplitude of the higher frequency (HF) oscillations. The complex analytic representations of each signal zLF(t) and zHF(t) are derived via the Hilbert transform (HT[.]).

Next, the envelope of the higher-frequency oscillations AHF(t) is bandpass-filtered within the range of LF oscillations and the resulting signal is submitted to an additional Hilbert transform to derive its phase dynamics component Æ‘(t)

which expresses the modulation of the amplitude of HF-oscillations by the phase of the LF-oscillations. Phase consistency between the two time-series was measured by means of both the original definition [21] and the imaginary portion of PLV, as synchronization indexes to quantify the strength of PAC.
The original PLV is defined as follows:

and the imaginary part of PLV as follows:

The imaginary portion of PLV is considered to be less susceptible to volume conduction effects in assessing CFC interactions. While the imaginary part of PLV is not affected by volume conduction effects, it could be sensitive to changes in the angle between two signals, which not necessarily imply a PLV change. In general, the imaginary portion of PLV is only sensitive to non-zero-phase lags and is thus resistant to instantaneous self-interactions associated with volume conductance [22]. For further details and applications, an interested reader can read our previous work [14,15].
In the present study, as was already mentioned we used 8 frequency bands which means that PAC is estimated for 7*6/2=21 cross-frequency pairs e.g. δÆ– θA ,δÆ– α1Awhere Æand A denote the phase and amplitude of each frequency band. Figure 2 demonstrates the pre-processing steps of the PAC estimator for a trial of subject 6 at target image 6.
[Figure 2 around here]
- Signal Power
We estimated the relative power of each band-pass frequency signal segment with the following equations:

The first equation quantifies the signal power (SP) of each frequency as the sum of the filtered signal squared per sample (3) while equation (4) divides the SP by the sum of the SP from all the frequencies which gives the relative signal power (RSP). The whole approach was repeated for every trial, sessions and subject.
2.4.4. Machine learning and classification
Training data sets contained 405 target trials and 2025 non-target trials and validation data sets consisted of 135 target and 675 non-target trials (these are average values cf. Section 2.3).
Adopting sequential feature selection algorithm, we detected the characteristic cross-frequency pair via PAC value that gives the highest discrimination of each target images compared to the rest based on the training data set. Additionally, we used the same feature extraction algorithm to detect the relative signal power that separate the counted flashing images from the non-counted images.
We trained a multi-class SVM classifier based on the selected PAC estimate from specific cross-frequency pairs and then we tested the classifier to the validation data to get the response tailored to each target image [23]. The training test consisted of the first session while the rest three sessions were used for validating the whole analytic scheme. A k-nearest neighbour (k-NN) classifier was applied to differentiate the attended from the non-attended flashing images prior to multi-class SVM classifier.
2.4.5 Performance Evaluation
Classification accuracy and ITR were calculated for the offline experiments separately. The method for calculating ITR (in bits per second) was as follows (5):

Where N is the number of classes (i.e., 6 in this study), P is the accuracy of target identification, and T (seconds per selection) is the average time for a selection.
- Results
- δ-θ Phase-to-Amplitude Coupling as a Valuable Feature for the BCI-P300 System
We estimated both PAC and relative signal power (RSP) for the first 32 samples (60 ms) increasing the window up to 500 ms (256 samples) with a step of 12 samples (5 ms) . The sequential feature selection algorithm detected only one PAC feature from the 21 possible cross-frequency pairs as the unique candidate feature to separate the six classes of images-stimuli. δÆ– θA was the selected feature for both disabled and able-bodied subjects.
The group-averaged classification performance was  for each sensor location using the first 100 ms for both able-bodied and disabled subjects. The errors were detected on the trials where the subject missed the flashing image. The classification performance with the use of a kNN-classifier prior to the multi-class SVM was 100 % for every subject and for all the pre-selected sensors namely PZ,OZ,P3,P4,P7,P8 EEG sensors. Figure 3 and Figure 4 illustrates the trial-related (grand-averaged) PAC-connectivity patterns (comodulograms) for subject 6 (able-bodied) and subject 1 (disabled) correspondingly from target and non-target trials for each flashing image. Comodulograms differed by contrasting target vs non-target within each subject and target image but also between the two images. δÆ– θA was the unique feature for both disabled and able-bodied subjects that can clearly predict the target image for both groups.
[Figures 3 and 4 around here]
- Attention and Alpha Power
Prior to multi-class SVM, we applied a kNN-classifier based on α1 signal power which was selected as the feature that can discriminate counted from non-counted flashing images. The kNN-classifier performed 100 % clear filtration of attended from non-attended trials for each subject and further improved the performance of multi-class SVM to 100 %. We achieved this performance using α1 signal relative power estimated from the first 100 ms for both able-bodied and disabled subjects.
The classification performance with the kNN-classifier was 100 % for every subject and for all the pre-selected sensors namely PZ,OZ,P3,P4,P7,P8 EEG sensors.
Table 2 summarizes the group-averaged relative signal power (RSP) of α1 frequency band for attended versus non-attended images.
Table 2. Group-averaged α1 signal relative power for attended and non-attended images.
|
Attended |
Non-Attended |
|
|
Able Bodied |
|
|
|
Disabled |
|
|


- Performance Evaluation
In the present study, we succeeded bitrates of 10 bits/sec for both disabled and able-bodied subjects correspondingly for all the sensor locations used on the whole analysis. The time for estimation of PAC and testing the trial was 0.00001 sec on a Windows 7 -Intel 7 – 8-core machine.
- Discussion
A novel approach of how to analyse single-trials in a BCI system was introduced based on the estimation of cross-frequency coupling (CFC) and namely phase-to-amplitude coupling (PAC). PAC was estimated within EEG sensors from single-trials recorded during a visual evoked experimental paradigm. The proposed analytic scheme based on the extraction of unique features from the CFC patterns on a single-trial basis and namely the δÆ– θA coupling, as a unique feature for both able-bodied and disabled subjects. Our experimentations showed a high classification rate (99.7%) based on the proposed PAC feature. Additionally, the superiority of our approach compared to alternative popular methodologies like the use of the original recordings was evident from the succeeded bitrates (10 bits/sec) and also of the response time of the classification system (0.00001 sec). Complementary, using a binary classifier trained with α1 relative signal power prior to the multi-class SVM, we differentiated the attended from the non-attended stimuli which further improved the classification performance up to 100% in both groups.
Compared to many other P300-based BCI systems designed for disabled users, we succeeded the highest classification accuracy and bitrates higher than the original presented dataset [7]. In previous studies like the one of Sellers and Donchin (2006) [12], the best classification accuracy for the able-bodied and ALS subjects was on average 85% and 72% correspondingly [12]. Hoffmann et al., succeeded absolute classification accuracy for both disabled and able bodied subjects for the first demonstration of the current dataset. However, he used longer time series of over 15-20 secs by concatenating trials in order to train better the classifier. Additionally, he used one classifier per image per each of the twenty block and the final outcome derived as the majority voting of the twenty classifiers. Here, using phase-to-amplitude coupling as the appropriate descriptor of the evoked response in the parietal brain areas and a multi-class SVM classifier, we performed almost absolute accuracy (99.97) on a trial basis. Using an additional binary k-NN classifier and α1 relative signal power prior to multi-class SVM, we separated the attended (counted) from the non-attended (not counted) trials leading to zeroing the misclassified trials from the multi-class SVM classifier for every subject. This procedure further improved the classification performance from 99.97 to 100% for each subject. We succeeded bitrates faster (10 bits/sec) than any other BCI system including the fastest spelling system presented recently (5.32 bits/sec ; [24]). In a previous study of Piccione et al. (2006) [11] average bitrates of about 8 bits/min were reported for both disabled and able-bodied subjects. Hoffman et al., 2008 [7] reported average bitrates obtained with electrode configuration (II) (8 electrodes) 12.5 bits/min for the disabled subjects and 10 bits/min for the able-bodied subjects.
According to Klimesch’s α theory, on the early stages of perception, α “directs the information flow towards to neural substrates that represent information relevant for the encoding system (e.g. visual stimulus to visual system, voice/sound to auditory system). The physiological main function of α is linked to inhibition. Klimesch’s α theory hypothesizes that α enables to have access to stored information by inhibiting task-irrelevant neuronal substrates and by timing/synchronizing the cortical activity in task-relevant neuronal systems. A lot of research findings showed that both evoked α and phase locking are evidence of a successful encoding of global stimulus features in an early post-stimulus interval of about 0-150 ms [25].
Besides the cross low-frequency/high-frequency coupling (e.g.,θ-γ; 26,27), there are many evidences [28-31] that CFC exists also between the low-frequency bands (e.g., delta-theta, delta-alpha, and theta-alpha). [29] introduced a hypothesis about the “hierarchical” organization of EEG oscillations suggesting that the amplitude of the brain oscillations at a characteristic frequency band can be modulated by the oscillatory phase at lower frequency. In particular, they found that δ (1-4 Hz) phase modulates θ (4-10 Hz) amplitude, and θ modulates γ (30-50 Hz) amplitude in primary auditory cortex of awake macaque monkeys [29]. This multiplex coupling or ‘nesting’ of brain rhythms might reflect a general brain organizational principle, as evidence of coupling (mainly θ-γ) has also been observed in animals (e.g. rats,cats) and humans [32].
For instance, in auditory cortex, δ-band modulates the amplitude of θ-band ICMs, whose phase in turn modulates the amplitude of γ-band ICMs [33]. This indirect enhancement effect uses the ongoing activity of local neural activity in the primary auditory cortex. Their hypothesis supports the notion that neural oscillations reflect rhythmic shifting of excitability states of neural substrates between high and low levels. This hypothesis is supported by the fact that oscillations can be predicted by visual input such as the auditory input arrives during a high excitability phase and is amplified. In the present study, we demonstrated that δ (0.5-4 Hz) phase modulates θ (4-8 Hz) amplitude over visual brain areas due to flashing images, their content and mainly was observed on parietal EEG recording sites.
We should also mention that the reason why δÆ– θA coupling discriminates the six flashing images can be directly linked to the content of the images. Visual attention samples image stimuli rhythmically demonstrating a peak of phase at 2 Hz [34] while flashing images induced rhythmic fluctuation at higher frequencies (6-10 Hz) [35] here within θ frequency range [4-8 Hz].Finally, the work of Karakas et al., ([36]) showed that the ERP represents interplay between the oscillations that are mainly in the δ and θ frequencies and directly linked to P300 [37].
- Conclussion
In this work, an efficient algorithmic approach was presented to a P300-based BCI system for disabled subjects. We have shown that absolute classification accuracies and the highest reported bitrates can be obtained for severely disabled subjects under the notion of cross-frequency coupling and namely phase-to-amplitude coupling. Specifically, δ (0.5-4 Hz) phase modulates θ (4-8 Hz) amplitude proved to be the candidate feature from PAC estimates that supported the highest classification accuracy, the fast bitrates and the fast response time of the multi-class system. Due to the use of the P300, only a small amount of training (trials from 1st session as a training set and 100ms per trial) was required to achieve good classification accuracy.
Future improvements to the work presented could be the design of useful BCI applications adapted to the needs of disabled users. Also it might be useful to perform exploratory analysis on larger populations and on real-time to further validate the results found in the present work.
Acknowledgements
SID was supported by MRC grant MR/K004360/1 (Behavioural and Neurophysiological Effects of Schizophrenia Risk Genes: A Multi-locus, Pathway Based Approach)
References
- Farwell LA, Donchin E. Talking off the top of your head: toward a mental prosthesis utilizing event-related brain potentials. Electroencephalogr Clin Neurophysiol 1988;70:510-23.
- Polikoff J, Bunnell H, Borkowski W. Toward a P300-based computer interface. In: Proceedings of the RESNA’95 Annual Conference; 1995.
- Bayliss JD. Use of the evoked P3 component for control in a virtual apartment. IEEE Trans Neural Syst Rehab Eng 2003;11(2):113-6.
- Xu N, Gao X, Hong B, Miao X, Gao S, Yang F. BCI competition 2003 Data Set IIb: Enhancing P300 wave detection using ICA-based subspace projections for BCI applications. IEEE Trans Biomed Eng 2004;51(6):1067-72.
- Kaper M, Meinicke P, Grosskathoefer U, Lingner T, Ritter H. Support vector machines for the P300 speller paradigm. IEEE Trans Biomed Eng 2004;51(6):1073-6.
- Rakotomamonjy A, Guigue V, Mallet G, Alvarado V. Ensemble of SVMs for improving brain-computer interface P300 speller performances. In: Proceedings of International Conference on Neural Networks (ICANN); 2005.
- Hoffmann U, Vesin J-M, Ebrahimi T. An efficient P300-based brain-computer interface for disabled subjects. Journal of Neuroscience Methods 167 (2008) 115-125.
- Thulasidas M, Guan C, Wu J. Robust classification of EEG signal for brain-computer interface. IEEE Trans Neural Syst Rehab Eng 2006;14(1):24-9.
- , , ,, , and .P300 brain computer interface: current challenges and emerging trends. . 2012; 5: 14.
- Farwell LA, Drew C. Richardson,Graham M. RichardsonBrain fingerprinting field studies comparing P300-MERMER and P300 brainwave responses in the detection of concealed information. 2013, 7, , pp 263-
- Piccione F, Giorgi F, Tonin P, Priftis K, Giove S, Silvoni S, Palmas G, Beverina F. P300-based brain-computer interface: reliability and performance in healthy and paralysed participants. Clin Neurophysiol 2006;117(3):531-7.
- Sellers E, Donchin E. A P300-based brain-computer interface: initial tests by ALS patients. Clin Neurophysiol 2006;117(3):538-48.
- McCane P300-based Brain-Computer Interface (BCI) Event-Related Potentials (ERPs): People with Amyotrophic Lateral Sclerosis (ALS) vs. Age-Matched Controls.
- Dimitriadis SI, Laskaris NA, Bitzidou MP, Tarnanas I and Tsolaki MN (2015) A novel biomarker of amnestic MCI based on dynamic cross-frequency coupling patterns during cognitive brain responses. Front. Neurosci. 9:350. doi: 10.3389/fnins.2015.00350
- Dimitriadis SI, Laskaris NA, Simos PG, Fletcher JM and Papanicolaou AC (2016b) Greater Repertoire and Temporal Variability of Cross-Frequency Coupling (CFC) Modes in Resting-State Neuromagnetic Recordings among Children with Reading Difficulties. Front. Hum. Neurosci. 10:163. doi: 10.3389/fnhum.2016.00163
- , , , , , , , . Altered cross-frequency coupling in resting-state MEG after mild traumatic brain injury.
2016 Apr;102:1-11. doi: 10.1016/j.ijpsycho.2016.02.002. Epub 2016 Feb 22
- Canolty RT and Knight RT (2010) The functional role of cross-frequency coupling. Trends Cogn Sci 14(11):506-15.
- Buzsáki, G. (2010). Neural syntax: cell assemblies, synapsembles, and readers. Neuron 68, 362-385. doi: 10.1016/j.neuron.2010.09.023
- Buzsáki, G., Logothetis, N., and Singer, W. (2013). Scaling brain size, keeping timing: evolutionary preservation of brain rhythms. Neuron80, 751-764. doi: 10.1016/j.neuron.2013.10.002
- Voytek B, Canolty RT, Shestyuk A, Crone NE, Parvizi J, Knight RT (2010) Shifts in Gamma Phase-Amplitude Coupling Frequency from Theta to Alpha Over Posterior Cortex During Visual Tasks. Front Hum Neurosci 4:191
- Lachaux, J. P., Rodriguez, E., Martinerie, J., and Varela, F. J. (1999). Measuring phase synchrony in brain signals. Hum. Brain Mapp. 8, 194-208.
- Nolte, G., Bai, O., Wheaton, L., Mari, Z., Vorbach, S., and Hallett, M. (2004). Identifying true brain interaction from EEG data using the imaginary part of coherency. Clin. Neurophysiol. 115, 2292-2307. doi: 10.1016/j.clinph.2004.04.029
- T. Joachims, Making Large-Scale SVM Learning Practical. Advances in Kernel Methods РSupport Vector Learning, B. Sch̦lkopf and C. Burges and A. Smola (ed.), MIT Press, 1999.
- Xiaogang Chen, Yijun Wang, Masaki Nakanishim, Xiaorong Gao, Tzyy-Ping Jung, and . High-speed spelling with a noninvasive brain-computer interface. PNAS vol. 112 no. 44
- , , and .Alpha Oscillations and Early Stages of Visual Encoding. . 2011; 2: 118.
- 1, .Cross-frequency coupling in real and virtual brain networks. 2013 Jul 3;7:78. doi: 10.3389/fncom.2013.00078. eCollection 2013.
- , , , , , , Intrinsic Coupling Modes: Multiscale Interactions in Ongoing Brain Activity.Neuron , 20 November 2013, Pages 867-886
- Voytek, B., Canolty, R. T., Shestyuk, A., Crone, N. E., Parvizi, J., and Knight, R. T. (2010). Shifts in gamma phase- amplitude coupling frequency from theta to alpha over posterior cortex during visual tasks. Front. Hum. Neurosci. 4:191. doi: 10.3389/fnhum.2010.00191
- Lakatos, P., Shah, A. S., Knuth, K. H., Ulbert, I., Karmos, G., and Schroeder, C. E. (2005). An oscillatory hierarchy controlling neuronal excitability and stimulus processing in the auditory cortex. J. Neurophysiol. 94, 1904-1911. doi: 10.1152/jn.00263.2005
- Cohen, M. X. (2008). Assessing transient cross-frequency coupling in EEG data. J. Neurosci. Methods 168, 494-499. doi: 10.1016/j.jneumeth.2007.10.012
- Isler, J. R., Grieve, P. G., Czernochowski, D., Stark, R. I., and Friedman, D. (2008). Cross-frequency phase coupling of brain rhythms during the orienting response. Brain Res. 1232, 163-172. doi: 10.1016/j.brainres.2008.07.030
- A. Bragin, et al. Gamma (40-100 Hz) oscillation in the hippocampus of the behaving rat J. Neurosci., 15 (1995), pp. 47-60
- C.E. Schroeder, P. Lakatos, Y. Kajikawa, S. Partan, A. Puce. Neuronal oscillations and visual amplification of speech. Trends Cogn. Sci., 12 (2008), pp. 106-113
- ; . (2014).The dynamics of attentional sampling during visual search revealed by Fourier analysis of periodic noise interference. Journal of Vision February ,14, 11.
- , (2012).Attention Samples Stimuli Rhythmically. , p1000-1004
- Karakas S., Erzengin O. U., Basar E. (2000b). A new strategy involving multiple cognitive paradigms demonstrates that ERP components are determined by the superposition of oscillatory responses. Clin. Neurophysiol. 111, 1719-1732.
- Demiralp T, Ademoglu A, Comerchero M, Polich J (2001) Wavelet analysis of P3a and P3b. Brain Topography 13: 251-267.

Figure 1. The six flashing images.
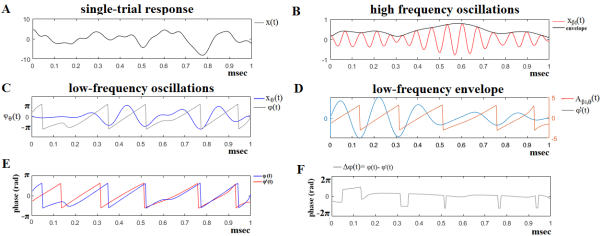
Figure 2. The algorithmic steps for PAC estimation. Using the first single-trial signal from session 1 and flashing image 1 (A), from the P300 of an able subject (subject 6), we demonstrate the detection of coupling between θ and β1 rhythm. To estimate θ-β1 PAC, the raw signal was band-pass filtered into both a (B) low-frequency θ (4-8 Hz) component where its envelope is extracted as well as (C) a high-frequency β1 (13-20 Hz) component where its instantaneous phase is extracted. (D) We then extracted the amplitude and the instantaneous phase of the band-passed β1 (13-20 Hz) and filtered this amplitude time series at the same frequency as θ (4-8 Hz), giving us the θ modulation in lower β amplitude. (E) We then extracted the instantaneous phase of both the θ-filtered signal and the θ-filtered lower-β amplitude and computed the phase-locking between these two signals. The latency depended differences (F), will be used in estimating the phase-locking (iPLV) that will reflect the PAC-interaction between the two involved brain rhythms. This phase-locking represents the degree to which the lower β (β1) amplitude is co-modulated with the θ phase.
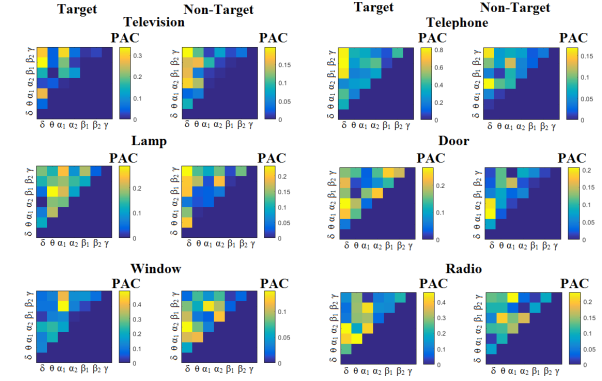
Figure 3 – subject 6 (able bodied).Demonstrating the level of CFC in P300 responses for each flashing image.
Trial-Averaged CFC patterns from the P300 responses for each target image and for both attended vs non-attended images.
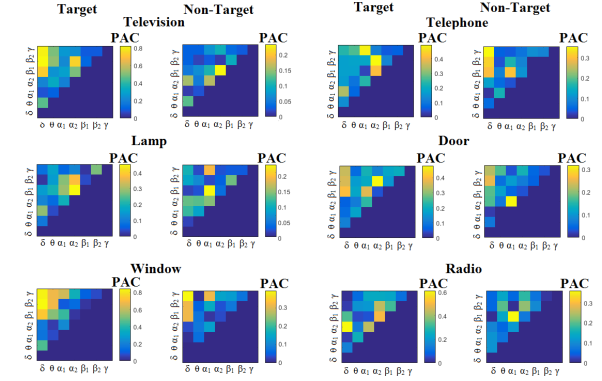
Figure 4- subject 1(disabled).Demonstrating the level of CFC in P300 responses for each flashing image.
Trial-Averaged CFC patterns from the P300 responses for each target image and for both attended vs non-attended images.