Pellet Catalyst Development using Ferroxcube Process
-  Pellet catalyst development using the Ferroxcube process
The pellet preparation followed the classic routine of the powder metallurgy industry (NTUA): hematite (Fe2O3) or magnetite (Fe3O4) powders were homogenized in a plasticizer and greasing environment, within a rotating pan (Figure 7). Consequently, disks were pressed in a 150 bar hydraulic press (Figure 8). NTUA used the experience of CERTH (coordinators of the HYDROSOL projects to proceed in the proper preparation of the pellets).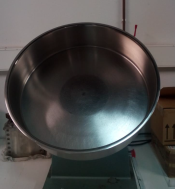                          ÂÂ
                          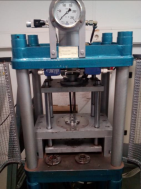
Figure 7. Rotating panFigure 8. The 150 bar hydraulic press
After the initial pelletization by the hydraulic press, the pellets were undergone sintering and reduction in a controlled atmosphere (oxygen-reduced atmosphere) oven as shown in Figure 9, in order to obtain the magnetite phase certified by XRD, as shown in Figure 10.
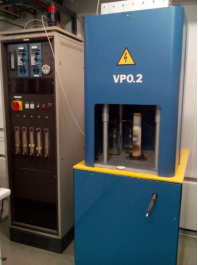
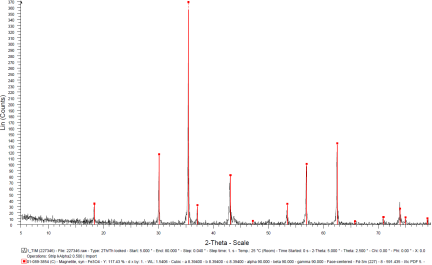
Figure 9. The sintering oven.Figure 10. XRD response of the sintered pellet, certifying the magnetite phase
Â
The porosity of the pellet and the neck development, offering substantial mechanical properties, have been monitored by SEM, as shown in Figure 11, as well as by the classic pressurizing methods.
This way, the magnetite pellets have been stabilized in mechanical, electric and magnetic properties, offering mechanical robustness and electric resistivity below 10 Ohm or <103 ïÂÂOhm.m (non-used pellet).
Furthermore, an advanced manufacturing process has been proposed by the SUN Unit to the above-mentioned industrial technique. During sintering and reduction process, magnetic field can be added externally to the sintering and reducing ovens to magnetically orient the magnetite dipoles in the desired direction, allowing for advanced Lorentz force control.
Â
2.2. A thin-film catalyst
We have conceived and developed a thin film device for the hydrogen production which can be integrated in an automated system. The device can also be used for the reduction and oxidation process in oxide semiconducting films supported by metal substrates-wafers, even if they do not exhibit coherent magnetic order. The method is based on the Lorentz forces acted on the reducing – oxidizing conducting electrons in the said oxide semiconducting films. Hence, this device can trap oxygen and hydroxyl from transmitted water, thus producing hydrogen. This such reduction and oxidation process in open air, as well as controlled atmosphere conditions.
A particular application, useful for the HELENIC REF project refers to the three-layer depicted in Figure 15. The upper layer consists of a magnetite film not thicker than 500 nm, an insulating thin film supporting the magnetite film, not thicker than 500 nm and finally a metallic wafer made of Al or other metal, supporting the insulating and the magnetite thin film.


Figure 15. Schematic of the catalyst
Possible manufacturing methods include electrodeposition, physical vapor deposition, chemical vapor deposition as well as lithography and masking methods for the generation of electric contacts on the upper thin film.
Concerning Fe3O4 (magnetite) film, a preferable but not obligatory condition is to be able to provide magnetic order in all grains of the ferrimagnetic cells of the oxide. This is achieved by magnetic field during deposition or by post-processing magnetic field annealing with subsequent field cooling.
The desired properties of the Fe3O4 (magnetite) film are indicatively as follows:
- Structure of the magnetite phase, which can be certified by X-ray powder diffraction
- Multi-grained microstructure with small necks between grains, monitored by Electron Microscopy
- Resistivity below 10 kOhm, indicative of semiconducting phase
- Magnetic order, observed by monitoring the magnetic hysteresis loop
- Mechanical robustness observed by hardness and wear measurement
Applying electric current through the metallic support of the film results in magnetic field parallel to the surface of the film and vertical to the applied electric current. The amplitude of this field is:

Where I is the applied electric current and a the thickness of the film. If the thickness a (sum of the magnetite film and the insulating thin film) are less than 1 ïÂÂm and the current I is C Amperes, then the applied field is:
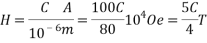
Thus, the applied field is controllable by the applied electric current through the metallic support. This current can easily be in the order of one Amperes in dc mode or several tens of Amperes in pulsed mode, if the thickness of the metallic support is in the order of 100 ïÂÂm, thus allowing the transmission of magnetic field larger than 1 T in the vicinity of the oxide semiconducting film.
Therefore, passing electric current through metallic support, one can simulate the magnetic field vertical to the direction of electric current passing through the magnetite thin film. The directions of these two electric currents characterizes the direction of the Lorentz force on the conducting electrons of the magnetite film. Parallel currents result in forcing the electrons towards the insulating thin film, while anti-parallel currents force them towards the surface of the magnetite film. These two different directions of Lorentz forces have a different effect on the operation of the magnetite thin film, acting as catalyst for the production of hydrogen.
Passing electric current along the magnetite film, independent on the electric current passing through the metallic substrate of the magnetite film, (i.e. from another source), along the same direction of the current transmitted to the metallic substrate, results in a Lorentz force acting on the charge carriers (electrons) moving them from the surface towards the insulating thin film. Thus, the surface of the magnetite film becomes activated, in other words is reduced due to the removal of the mentioned Lorentz electrons.
Activation is the generation of electron vacancies, offering the generation of new oxygen vacancies (excess of oxygen vacancies). Thus, the resistivity drops, and the applied voltage results in higher current, which increases the local temperature to 280 – 320C. Such temperature increase is observable by any kind of pyrometer. The temperature increase is dependent on the combination of the electric current passing through the oxide semiconducting film and the magnetic field transmitted to it due to the electric current passing through the metallic support.
The effect is reversible and un-hysteretic: increase or decrease of the amplitude of I x H product, where I is the applied current on the oxide film and H the field resulting from the current on the metallic substrate, results in un-hysteretic and reversible increase or decrease of the temperature and reduction of the oxide film respectively.
Such activation can be maintained even in open air: the competition between the Lorentz electrons based reduction and the free air oxidation finally results in oxidation which can also be macroscopically observed by the decrease of the activated (reduced) area on the free surface of the film. Having limited the current passing through the metallic support may result in activation (reduction) shrinkage. In this case, increasing the current transmitted to the metallic substrate before the radiation disappears, or before oxygen vacancy excess disappears, the oxygen vacancy excess is rejuvenated. Such rejuvenation is completely reversible by using the magnetic field produced by the current passing through the metallic support (in the order of 1 T).
After complete oxidation (phase transformation of all the Fe3O4 film to Fe2O3) such oxygen vacancy excess and consequent reduction of the compound is impossible with magnetic fields of this order.
The reduction and oxidation process can be monitored by measuring the surface resistivity of the magnetite film. Such resistivity depicts the increase or decrease of oxygen vacancies on the surface and consequently the bulk of the oxide pellet. Increase and decrease of this resistivity is equivalent to the oxidation and reduction of the resistivity of the surface respectively.
This effect is observable in all types of oxide semiconducting films even in the absence of coherent magnetic order in them. To be able to observe this effect in oxide semiconducting films, they should be in a continuous solid state form, exhibiting even a small electric conductivity, and provided that magnetic field and electric current of proper waveform and amplitude are simultaneously applied on the semiconducting oxide film and the conducting (metallic) support.
Such reduction mechanism can be used in the reduction of compounds passing on or through the film surface. Our focus is the reduction of pure vapor water to H2, by means of trapping the oxygen or the hydroxyl of the water molecule to the reduced (or activated) magnetite. Such oxidation with consequent hydrogen production can be reversed back to oxide reduction (activation) by means of stopping the water vapor transmission. This way, the two electric currents will reduce (activate) again the surface of the oxide film, provided that no water vapors are transmitted to the pellet surface or body.
A certain application of such effect is the use of the said pair of Fe3O4 (magnetite) film with its metallic support for the production of hydrogen and oxygen from water vapors, using the following algorithm:
- Independent electric currents pass through the metallic support and the oxide semiconducting film in the same direction. Thus, the surface of the oxide semiconducting film is reduced (activated).
- Then, water vapor is transmitted on the surface of the oxide semiconducting film, resulting in oxygen trapping, hydrogen production and oxidation of the surface of the oxide semiconducting film.
- As soon as the resistance of the surface of the oxide semiconducting film exceeds a certain threshold, indicating reach to a critical level of oxide film surface reduction, the water vapor transmission is stopped.
- Thus, the oxide film surface is re-activated, followed by consequent oxygen release, until the resistance of the oxide film surface reaches a minimum threshold, indicating proper reduction (activation), which is proper for oxygen trapping.
- Then, water vapor is re-transmitted to the re-activated oxide film surface for hydrogen production.
The production of hydrogen and oxygen is followed by an automatic storage of these two gases in different chambers to be used for any scope, like thermal combustion or fuel cell operation or other purpose.
Development of the thin film catalysts
The Dynamic Hydrogen Bubble Template (DHBT) is an excellent method for the fabrication of macrostructures with nanoporous side walls. The method has been named from the phenomena when a series of hydrogen-bubbles generated on the surface of the substrae act like a dynamic negative template. Figure 1 demonstrates the theoretical approach of the technique. Figure 1(a) illustrates the hydrogen-evolution taking place on the surface there is no metal/metal-oxide deposition. The size of the bubbles increasing along the distance from the substrate surface. Fig 1(b) shows the SEM-image of copper nanofoams prepared by DHBT.
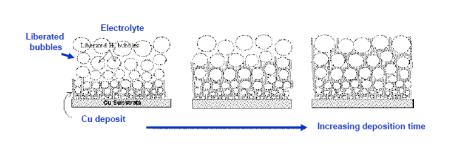
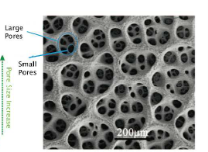
Figure 1. (a) Simplified description of DHBT generated metal/metal-based foams; (b) Honeycomb-like Cu-deposit structure made by DHBT.
The electrochemical deposition procedure of the development of the catalyst is divided in two main parts. At first preliminary experiments on deposition of magnetite film were carried out in order to determine the orders of amplitude of the different involved parameters (current density, geometry etc.). , the electrochemical deposition of iron-oxide films was carried out as a preliminary approach. Based on the results of the characterization, the parameters of the deposition were varied in a high range in order to obtain 3D-structured porous nanofoams.
The films were electrodeposited onto copper substrates (purity: 99.5%). The substrates were mechanically polished with 800 and 2000 emery papers, respectively. Henceforward, the polished substrates were ultrasonically cleaned in deionized water, ethanol and acetone, respectively. The 2 cm2 active surface area of the substrate was ensured by commercial nail-polish and insulating tape. The galvanostatic deposition was carried out in a two-electrode cell using a DC Power Supply. Platinum-mesh was used as counter electrode.
Two different arrangement of the working electrode have been tested as shown in Figure 2. The electrolytic bath was a strongly alkaline solution with pH 12.5 made of 0.037 M Fe2(SO4)3.x H2O, 0.1 M triethanolamine (TEA) and 2 M NaOH. After mixing the components at T = 80 ï‚°C the solution had greyish-green color and no turbidity was observed.
The parameters of the deposition process were varied in the terms of current density, bath temperature and deposition time. The range of cathodic current density was chosen j = 5-15 mA.cm-2, the depostion time was given from 5 min to 6 hours and the bath temperature was adjusted T = 60-90 ï‚°C. The nominal thicknesses of the prepared structures were calculated by using the Faraday-law.
The surface morphology of the deposited film-layers were studied by scanning electron microscope (Nova NanoSEM 230) and the crystallographic characterization was determined by X-ray diffraction (Bruker D8 Advance, Cu radiation-40kV, 35mA).
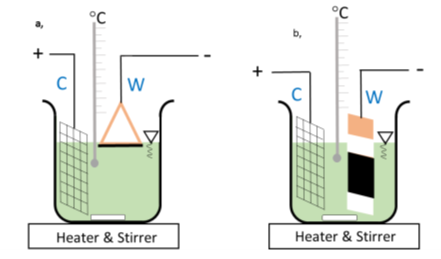
Figure 16. a) copper triangle used as working electrode (W) by turning the active surface towards the surface of the electrolyte b) copper-plate (W) used as working electrode by immersing it totally and by turning the active surface towards the counter electrode (C).
Concerning the development of 3D-structured porous films, the substrate deposition was not changed (Cu-foil, purity: 99.5%). SiC polishing papers were used in grade of 800, 1500, 2500 and 4000, respectively as a surface pre-treatment. All the pre-treated samples were ultrasonically cleaned in deionized water, ethanol and acetone, respectively. In that case, the active surface area of the substrates was reduced to 0.5 cm-2 and fixed with nail-polish and insulating tape. The galvanostatic deposition was carried out in a two electrode cell using a BioLogic SP 300 potentiostat. Platinum-wire was used as counter electrode.
Concerning the result of the film-deposition the arrangement of the working electrode was set in vertical position. The electrolytic bath, concentrations and its properties were the same as described above. The cathodic current density was varied in the range ofj = 0.075-1 A.cm-2, the depostion time was changed between 30 sec to 180 s and the bath temperature was adjusted T = 90 C. Similar films have also been developed by using sputtering deposition and electron-gun aided deposition (Figure 17).
Apart from the electrolytic method, thin magnetite films were also deposited onto insulating films by usign spuutering and electron gun physical evaporation at the NTUA. However, the obtained results on the porosity of the magnetite films are not comparable with the DHBT method and therefore they are not demonstratable at their current stage. Nevertheless, experiments are under way to obtain PVD films of the quality observed in the electrodeposited films.
- Characterization of catalysts
- Structural analysis
The catalyst pellets were prepared by a proprietary process from Fe3O4 powders. IP SAS used Fe3O4 powder with declared purity better than 99% and nominal grain size of 2-4um supplied by chemicalstore.com, product code FE3O4M1. The phase composition determined by XRD (X-Ray Diffraction) is shown in Figure 38. Minor traces of Hematite can be observed at 32.8° 2Theta for the sample produced at IP SAS.
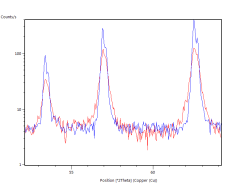
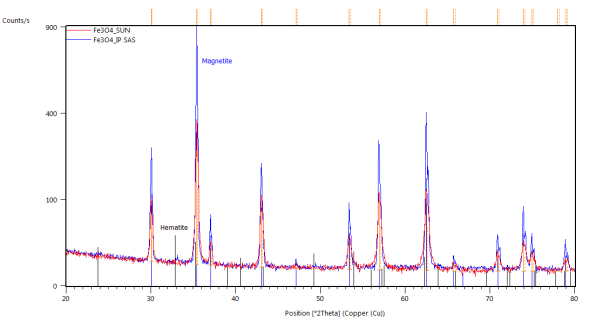
Figure 38. XRD patterns from pellets prepared by SUN (red) and IP SAS (blue). Marked constituent phases are Magnetite (blue lines) and Hematite (black lines)
A typical XRD response in the bulk SUN pellets and in bulk CERTH pellets is illustrated in Figure 1, demonstrating exclusive magnetite presence.
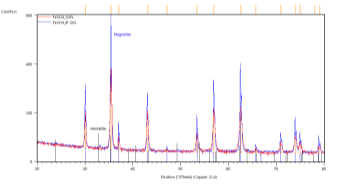

Figure 1. XRD response of bulk pellets from SUN (left) and CERTH (right) illustrating exclusive presence of magnetite
Phase transformations were studied by the means of in-situ XRD presented in Figure 41. Samples were mortar milled to obtain a fine powder that could be spread on the sample holder of the furnace. Milling force was kept minimal to preserve the structure of the pellet parts. Linear heating with indicated rate was used to obtain well-defined diffraction maxima with respect to the signal to noise ratio. Diffractometer was configured for parallel beam illumination with a secondary LiF monochromator to supress fluorescence from the Fe containing pellets.
Formerly purely magnetite pellets are transforming to hematite in the vicinity of 300°C. After the transformation no other phase change was observed. Pellets supplied by SUN exibit the transformation at higher temparature than the pellets prepared at IP SAS. This can be atributed to the smaller size of the Fe3O4 crystallites in the SUN pellets.
Detailed pattern examination is shown in Figure 42. The studied powdered pellets exhibit only presence of magnetite and hematite respectively. Diffraction maxima at 26° 2Theta corresponds to SiO2 present as a thin layer grown on the non-reflective Si sample holder.
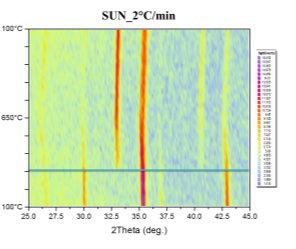
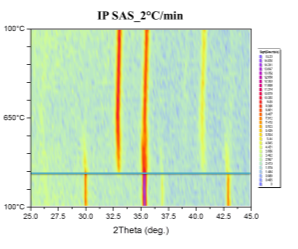
Figure 41. In-situ XRD patterns of catalysts in air atmosphere with indicated heating rate
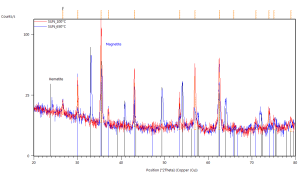
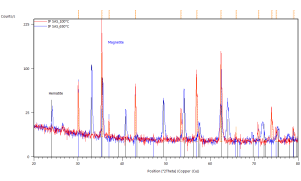
Figure 42. In-situ XRD patterns of annealed catalyst pellets at indicated temperatures.
Marked constituent phases Magnetite (blue lines) and Hematite (black lines).
Catalyst prepared at SUN left, IP SAS right.
Crystallographic study of the iron-oxide thin films samples was also realized. Figure 4 represents the identification of the observed peaks. Figure 4(a) shows the results of sample prepared in 3300 s in 70 ï‚°C bath with -5 mA.cm-2 current density. Grazing incidence XRD patterns of this sample indicate the presence of magnetite (blue lines) and copper substrate (green lines). Grazing angle was 2 (red curve) and 6 degrees (blue curve), respectively.
In Figure 4(b) the results of sample with same conditions as in Figure 4(a) can be seen, but in this case the current density was -9 mA.cm-2. Here, grazing incidence XRD patterns indicate iron (grey lines) and copper (green lines). Grazing angle was 2 (red curve) and 6 degrees (blue curve), respectively. Figure 4(c/1) and (c/2) show the results of XRD taken from the same sample with deposition conditions of 2 hours deposition time in 85 ï‚°C bath and -12.5 mA.cm-2 current density.


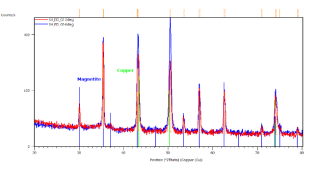
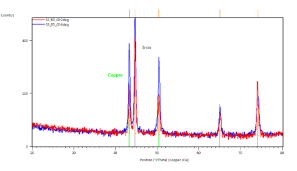


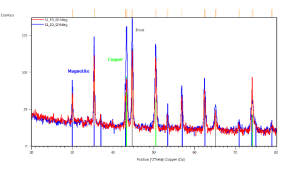
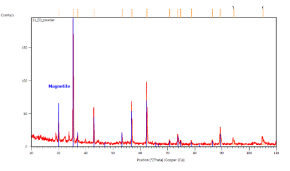
Figure 4. X-ray diffractograms of the iron-oxide electrodeposited samples prepared under different conditions. a, ÃŽâ€t=3300 s,T = 70 °C, j= -5 mA cm-2; b, ÃŽâ€t=3300 s, T = 70°C, j= -9 mA cm-2; c/1, ÃŽâ€t=7200 s, T = 85°C, j = -12.5 mA cm-2; c/2, powder scratched from the surface of sample c/1
In Figure 4(c/1) the grazing incidence XRD patterns were done on the sample with the substrate. Clear evidence of magnetite (blue lines), iron (grey lines) and copper as substrate (green lines). Grazing angle was 2 (red curve) and 6 degrees (blue curve), respectively. Figure 4(c/2) demonstrates grazing incidence XRD pattern of loose powder from the same sample as (c/1). Only magnetite phase (blue lines) is detected. Grazing angle was 2 degrees. The XRD results show clear evidence of magnetite if the current density does not exceed 8 mA.cm-2 cathodic current density (see Figures 4(a) and (b).
Apart from that, XPS studies have also been performed after the check meeting. For integration reasons, they are demonstrated only in the Milestone 1 document.
- Microstructural analysis
Morphology of pellets after preparation was studied by the means of SEM (scanning electron microscopy) shown in Fig. 39. The particle size is larger for the catalyst prepared by SUN. The particle size of sample prepared at IP SAS is in good agreement with the manufacturer specification and is rather homogenous in size distribution. Sample prepared at SUN is exhibiting a different size distribution ranging from very fine sub-micron particles up to particles with size increasing 50um shown in Fig. 39 and 40. As can be seen the porosity of the prepared pellets is higher for the pellet prepared at IP SAS.
The grid shown in Fig. 40 is protecting the sample from being destroyed by the magnetic field in the microscope and thus contaminating the microscope system by fine magnetic dust in the pole-piece, lens and detector system. It is worth to mention that the particle size is not directly explaining the diffraction maxima broadening shown in inset in Fig. 38. This is due to the fact that the diffraction domain size is rather different than the grain size of a particle. We can surely state that the diffraction domain size is smaller in the pellet prepared at SUN rather than at IP SAS despite the observed grain-size distribution.
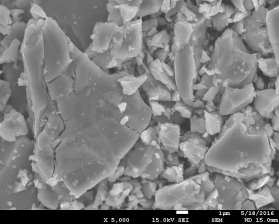
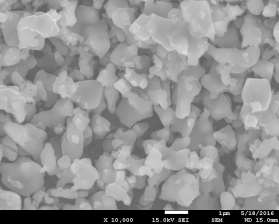
Figure 39. SEM micrographs of catalysts prepared by SUN (left) and IP SAS (right)
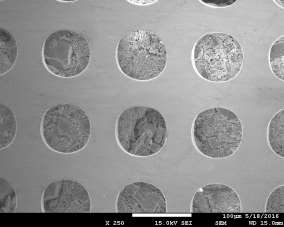
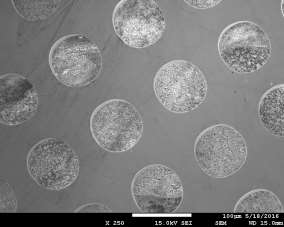
Figure 40. Low magnification micrographs of catalyst prepared by SUN (left) and IP SAS (right)
Micrographs from the CERTH pellets (Figure 41) illustrate a clear evidence of necks, responsible for the significant reduction of temperature.
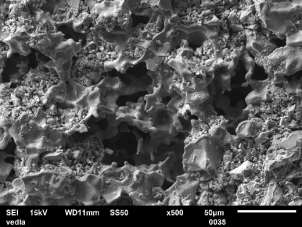
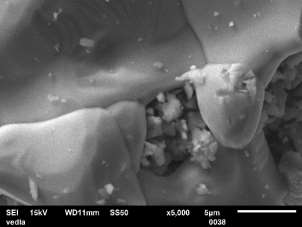
Figure 41. Micrographs of the CERTH pellets, illustrating the presence of micro-necks, responsible for the improvement of the electric and mechanical properties
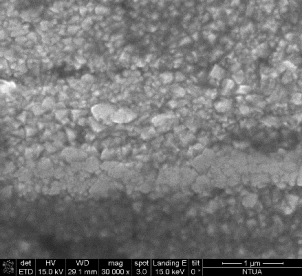
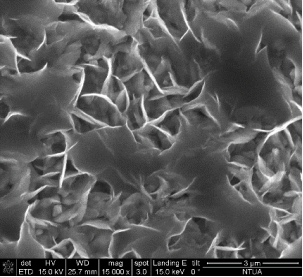
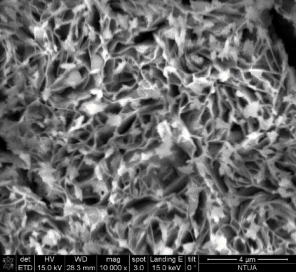
Concerning the thin film catalysts, SEM analysis was performed. Figure 3 demonstrates 4 different SEM-images of the prepared samples. Fig 3(a) was taken on a sample prepared in 300 s deposition period in 60°C bath with -7.5 mA cm-2 current density, and the nominal thickness was 2.24 μm. In Fig 3(b) can be seen the morphology of the sample prepared in 300 s at 70°C with-5 mA cm-2 current densitywith nominal thickness of 23.55 μm. Fig 3(c) shows the SEM-result of the sample deposited with the same bath temperature and current density as 3(b) but extended deposition time: ÃŽâ€t = 900 s (dn = 30.28 μm). Fig 3(d) represents the SEM-image of the sample prepared in the highest bath temperature 90°C with 5 min deposition time, -7.5 mA cm-2 current density (dn = 4.42 μm).
The SEM-images clearly show the structural changes by increasing the bath-temperature. Filamentous deposit structure has been observed at 90 ï‚°C. Due to the galvanostatic deposition mode the potential values have been not recorded. For better understanding of the structural formations potentiostatic deposition mode should be done.


 ÂÂ
    ÂÂ
     ÂÂ
  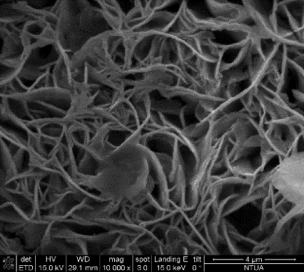
Figure 3. SEM-images of the electrodeposited iron-oxide samples with different deposition parameters (a) ÃŽâ€t=300 s,T= 60°C, j= -7.5 mA cm-2 at 30000X magnification (b) ÃŽâ€t=300 s, T= 70°C, j = -5 mA cm-2 at 15 000X magnification(c) ÃŽâ€t=900 s, T = 70°C, j= -5 mA cm-2at 10000X magnification (d) ÃŽâ€t=300 s, T = 90°C, j= -7.5 mA cm-2 at 10000X magnification.
Concerning nano-foam, due to the fact that the experiments were done in the close past the characterization of the prepared nanostructures was done only by scanning electron microscope. Figure 5 demonstrates the first promising results of the electrochemical deposition of iron-based 3D structures by using hydrogen generation on the surface as a negative template.
Such a structure was a result of applying -0.375 A.cm-2 and more negative current density, namely -1 A.cm-2 with different depositing times. Fig 5(a) to Fig 5 (c) represents a possible building process of the 3D networks with pore size range in 2-6 μm. Other type of deposit can be observed at Fig 5(d) to Fig 5(e) with numerous dendrites along the pore-sides by using current density -0.375 A.cm-2 with different deposition times. The formation of porous layer is not so obvious like in the previous case, but the size of pores are close in the same range than the pores formed at -1 A.cm-2.


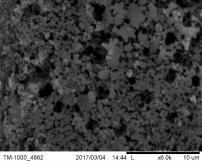
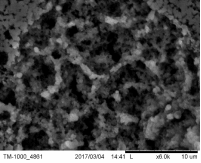
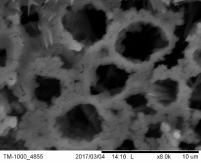
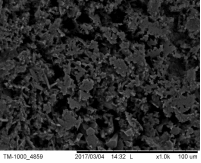
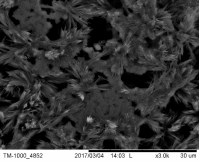
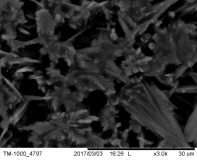
Figure 5 The SEM-images of deposited porous structures with different magnification at current density j = -1 A.cm-2 for (a) ÃŽâ€t=30s (b) ÃŽâ€t=60s (c) ÃŽâ€t=90s deposition time,and j = -0.375 A.cm-2 for (d) ÃŽâ€t=30s (e) ÃŽâ€t=60s (f) ÃŽâ€t=90s deposition time
Two type of deposits were carried out via electrochemical deposition. The SEM results of the thin-film preparation shows that filamentous structures can be obtained with low current densities (j < 10 mA.cm-2) by increasing the the bath temperature up to T = 90 ï‚°C. XRD results of the deposited thin-films have clear evidence of magnetite phase on the copper electrode if the current density does not exceed – 8 mA.cm-2.
Numerous characterization shall be done before coming to strong conclusions in iron-based nanofoam preparation. However, the results of the thin-film deposition mean that using more negative current densities can lead to the deposition of pure iron that is not the goal of the work. Therefore, several solutions can be considered to obtain magnetite nanofoams on the Cu-substrate like additives and chelating agents to widening the deposition range of magnetite phase. Also, the post-heat treatment of iron-nanofoams in commercial furnace can be done to obtain the preferable iron-oxide state.
- Properties
Electric properties
The electric resistivity of the pellets was monitored by using the four-probe method (Figure 111). The resistivity of the SUN pellets was determined to be between 1 and 10 kOhm, the resistivity of the CERTH pellets in the order of 5-10 Ohms and the resistivity of the thin film catalysts in the order of 10 Ohm.
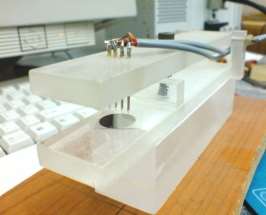
Figure 111. The four-point resistivity monitoring used to monitor the resistivity of the pellets and the thin films
An analysis of the electric resistivity is illustrated in the Deliverable D1.2 and the dependence of resistivity on field (Lorentz force) is illustrated in Milestone 1 document. However, it is hereby mentioned that apart from resistivity monitoring, we have started monitoring the impedance response (see Milestone 1) where the electronic conductivity of the magnetite becomes apparent.
All resistivity properties in the above mentioned ranges for each type of catalyst (SUN, CERTH and thin film catalysts), illustrating dependence on the magnetic field vertical to any of the two coordinates of the direction of the 4-point measurement have been considered acceptable since they offered different properties in the water-lysis effect (see Milestone 1): since all measurements of resistivity dependence on the applied field illustrated a resistivity change larger than 100%, this is the actual threshold set for resistivity acceptance.
Mechanical properties
The mechanical properties of the pellets and the films are useful for handling issues and operational ability in the reactors. Two main mechanical properties are useful, which quantify the handling issues: the wear and bending properties of the pellets and the films.
The wear properties of the pellets and the thin films have been tested by the pin-on-disk experiment illustrated in Figure 111.
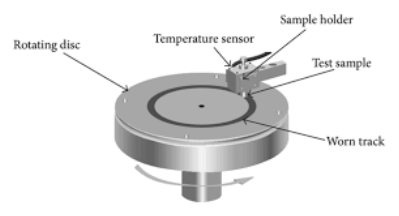
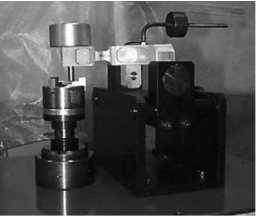
Figure 111. The schematic (left) and the actual set-up (right) of the used pin-on-disk setup
According to this arrangement, a small weight is used to load a ball pin on top of the pellets or the thin films. The wear is calculated by the exerted force on a load cell supporting the ball pin of the set-up. The developed channel and the lost material from the surface of the pellet are also an indication of the wear properties of the catalysts.
The wear was defined as n=0.2, n=0.6 and n=0.15 for the pellets of SUN, CERTH and the thin films respectively. The pellets of SUN and the thin films were able to withstand vertical forces up to 0.1 N, while the CERTH pellets were capable of withstanding 10-11 N.
From these results it has been concluded that the best properties were defined for the CERTH pellets, followed by the thin film catalyst, although the SUN pellet could also operate fairly well, since it was trapped in position inside the reactor cell.
The bending properties were monitored by using the stress-strain instrument of the Laboratory of Physical Metallurgy. Bending force before break of the SUN pellets was determined to be 5N, while the same value for the CERTH pellets was 650 N. Thin films could not demonstrate bending breaking force, although microstructure tests demonstrated break of some bonding necks at angles larger than 30o.
We have developed a simple instrument to test the handling ability of the produced pellets: two electric crocodile clips were used to handle the pellets. In case that the pellets were broken during handling they could not be used for the reactor, since these clips have been the harder possible means of handling those pellets.
For the case of thin film catalysts, the mechanical properties are not important: after their development, electric contacts made by silver and masking in the electron gun PVD instrument of the NTUA, were warranting electric connection without requiring mechanical robustness.
Thermodynamic properties
Thermal and magnetic properties were probed using thermogravimetric and calorimetric methods. Thermogravimetric measurements were performed on non-powdered pellet pieces with mass maintained in the 20-30 ïÂÂg range. Experiments were performed also with applied magnetic field of 20mT. The average magnetic weight of the samples was maintained between 1-2ug (sample weight was in 20-30ug range). Calorimetric measurements used the same sample mass as described above.
Thermogravimetric measurements without applied magnetic field are shown in Figure 43, right axis. The reproducibility test of the measurements pellet provided by SUN was used. The measuring accuracy is confirmed by varying the sample mass (32mg for red curve and 27mg for green curve) and time the measurements were performed (one week apart). The trend in weight change is for both of the samples identical and not exceeding 2% of the overall mass change. However, one can see correspondence with the change in the magnetic weight change (approximately 50%) and in-situ XRD diffraction experiment (magnetite-hematite transformation) in the same temperature range.
Thermogravimetric measurements with applied magnetic field reveal the magnetite-hematite transformation as a decrease in the magnetic weight (Figure 43). Pellet supplied by SUN exhibits sharp decrease at 300°C followed by Curie transition at 570°C. Pellet produced by IP SAS exhibits increase in the magnetic weight up to 290°C. Ongoing weight decrease corresponds to magnetite-hematite transformation. In both cases a fruther sluggish decrease after magnetite-hematite transformation is observed. This can be attributed to internal ordelirng of hematite-magnetite phase. In-situ XRD experiments did not evidence no other transformation under ambient air environment. Curie transformation for pellet produced at IP SAS is observed at 576°C. This observation confirms the statement of smaller crystallite size in the SUN sample since Curie temperature decrese in a magnetite compound is accompanied with smaller size of the constituent crystallites.
It is worth to mention that the sample was maintained under well monitored and controlled Ar atmosphere. One issue may arise in the moment of sample insertion into the thermogravimeter chamber leading to exposure of the apparatus to ambient air. The presence of oxygen-nitrogen mixture thus cannot be avoided in the sample and balance area. To avoid contamination of the thermogravimetric apparatus an instrument purge was done with duration of more than 10 minutes for each measurement.
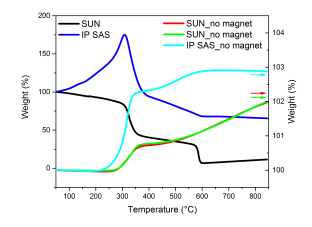
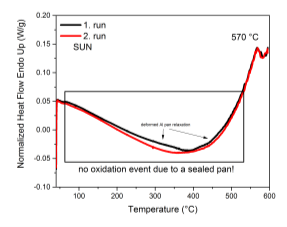
Figure 43. Thermogravimetric (left) and calorimetric measurements (right) of studied pellets. Heating rate 10°C/min, Ar flow 40ml/min.
To probe the possible contamination from the instrument or the more probable possibility to maintain residual oxygen content in the sample cavities two other measurement were performed on two distinct instrument environments.
The first measurement was cried out using a standard power compensated calorimeter with miniature furnace volume (<10ml), Ar flow from underneath the furnace and sample encapsulated almost hermetically. The sample was enclosed in a conventional Al sample pan and lid assembly and pressed using a standard sample press keeping the free volume minimal. In this case we can assume that the sample was sealing the cavities between the pan and the lid. The Ar flow was maintained at 40ml/min. The result is presented in Figure 43, right. Two subsequent heating cycles were performed without removing the sample. No obvious transformation was observed and only a minute change in the baseline was observed and corresponds to the relaxation of the deformed Al sample pan. Other weak feature that is visible on both cycles is the Curie temperature of the sample. The measured temperature well corresponds to the measured value from the magneto-thermogravimetric measurements.
The second measurement was carried out on a simultaneous thermal analyzer with sample and balance volume of similar size to the thermogravimetric apparatus but with exhaust close to the sample area reaching ambient. This instrument is capable of simultaneous measurement of heat evolution a weight change with or without applied magnetic field but with less precise control. The measured results are presented in Figure 44. General trend is very comparable to the measurement presented earlier. The weight change without applied magnetic field is reaching the very same values as with a conventional thermogravimetric apparatus. Applying magnetic field yields very similar trend as observed before. Heat evolution reveals expected changes in the temperature region reflecting previously observed magnetite-hematite transition, not measured on a fully sealed sample. It is worth to emphasize that from the heat evolution we can also observe the Curie temperature which exactly corresponds to previously described calorimetric measurement but with the absence of thermal effects in the transformation region of magnetite.
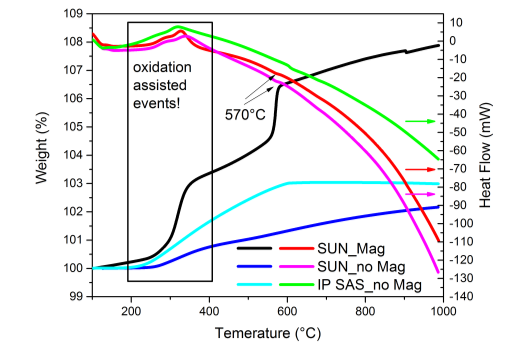
Figure 44. Simultaneous thermal measurement of indicated pellets. Heating rate 10°C/min
In the present study, we have described the phase transformation in pellets prepared either at SUN or at IP SAS. The master pellet was prepared from powders with different size distribution of crystallites but exhibiting very similar effects under changing temperature and sample gas environment. Under ambient air atmosphere the pellets undergo magnetite-hematite phase transition at 300°C followed by magnetite dissolution and formation of a stable hematite structure. Further investigations on the infulence of the sample environment and catalyst preparation are in progress.
Following the structural and properties characterization of the pellets we have concluded on the process of accepting or not the developed pellets. This process runs as follows:
- Pellets are developed in batches of 5
- The initial handling test (mechanical properties) runs first:
- For the bulk pellets, they are connected with crocodile clips and if they are not broken they are mechanically accepted
- For the thin films, the PVD deposition of the electric contacts using masking process takes place and the thin film catalyst is ready to be used
- Then, the resistivity tests will provide information on resistivity (or impedance) dependence on the magnetic field vertical to the direction of resistivity monitoring. In case that the change of electrical resistivity with field in the order of 250 mT is larger than 100%, then the pellets pass the resistivity test
- All pellets undergo surface XRD measurement. If the only present phase is the magnetite phase, then the samples pass the XRD measurement
- All pellets undergo a surface SEM test. In case that a crack, larger than the 1/4 of its diameter exists, the given pellet will not be used
- One of the pellets will be sacrificed for structural test: after splitting it in two (use of microtome) it will be tested in its cross-section by XRD. If the only present phase is the magnetite phase, then the samples pass the XRD treatment
- Finally, the cross section SEM analysis will provide the information on necking of the catalyst. This will not be a pass – no pass criterion, but it will be considered as one of the reasons affecting its performance
- General conclusions and organization of the next steps
The general conclusions of the work done up to this moment is that we have already realized the following:
- We have in-house developed certain catalyst precursors (powders) and characterization methods
- Pellet catalysts with given characteristics, offering the ability to develop criteria for approving them
- Thin film catalysts with nano-porous structure, promising operation in the reactors
All these together may allow for a concrete study of the three types of catalysts during the next period of the project:
- Study the pellet catalysts and their performance (WP2 and WP3)
- Develop an automated device based on the thin film catalyst
- Performing ab-initio and multi-scale modelling to provide the complete analysis of the catalytic behaviour of the magnetite
- Antipas, Statharas et al, Experimental and first principles’ characterization of functionalized magnetic nanoparticles, ChemPhysChem, 14 (9) , pp. 1934-1942, 2013
- , , 24 (3), pp. 197-219, 1998
- Madler et al, , 33 (2), pp. 369-389, 2002
- Sotiriou et al, , , 44 (14), pp. 5649-5654, 2010
- Kovacs et al, Electronic structure and charge ordering in magnetite: implications for theFe3O4 (001)-water interface, Molecular Simulation, Vol. 36, No. 15, December 2010, 1289-1296
- Suzdalev et al, Magnetic Properties of Monodisperse Nanomagnetite, Nanotechnologies in Russia, 2011, Vol. 6, Nos. 11-12, pp. 743-749
- C, 74, pp. 1-10, 2014
- , , 81, pp. 150-161, 2015