Performance of Guggenheim Investments: An Analysis
Â
Research Purpose
This research aims to analyze and evaluate six different funds and their benchmarks and risk-free rates in order to compare the overall performance of the funds from Guggenheim Investments and the selected funds from three different asset managers.
Research Design
The research involved 60 monthly observations (from January 2012 to December 2016) to analyze the performance of the Guggenheim Investments and the selected different asset managers, Aberdeen, Wells Fargo, and Pimco, which were selected from the top 500 global asset manager (Towers Watson, 2016). Three funds from Guggenheim Investments and three more funds from each asset manager, in total of six funds, were selected with similar investment strategies – Small-Cap Blend, Mid-Cap Value and Large-Cap Blend – for the consistency of the analysis. The performance would be measured in term of return and risk based on statistical and financial theory. The performance will be measured in term of return, risk and ratio.
Findings
All of the fund from Guggenheim Investments, from the results in this research, perform worse than the competitors funds in many ways. The ratios analysis shows lower level of risk rewarding from the poorer management of risk, the funds also generated lower level of return throughout the observation period. Furthermore, the regression analysis shows that all of the fund in this research utilize Fama French model effectively, but the competitors’ funds also utilized Carhart 4 Factors Model, incorporating the momentum factor which makes them perform better than the funds from Guggenheim Investments.
Research Limitations
Due to the small observation size, the daily and weekly volatility were ignored from this research. In term of data quality, using OLS regression may not be efficient to analyze the data as the data consisted with unit-root, which was caused by the price drift.
Research Implication
The research should provide a good example of how could an investor conduct the statistical analysis of fund performance analysis using E-View 9 and Microsoft Excel. The result of the research could support the investor, in term of analysis and decision making, to include funds as an asset class into their portfolio.
Contents
Â
Mutual fund has been around for many decades and is becoming more popular in both developed and emerging markets. As the mutual fund is managed by professional fund managers, it unlock many good features that non-professional investors desire such as well diversified portfolio, access to highly priced securities like bluechip stocks, infrastructure and real estates, or tracking any particular index which required a lot of money.
Many mutual funds are provided by asset management companies, some are doing good, some are doing bad. The performance evaluation can be difficult for individual investors that are not specialized in this area of work. This research aim to provide basic knowledge and example of assessing the performance of mutual funds, both in terms of risk and return, to simplify this process for every investor in order for them to effectively and efficiently invest in mutual funds.
Data Collection
All of the numbers in this research including total return index of each fund and their benchmark, risk free rate are collected from Bloomberg Terminal. The funds’ fact sheets are directly downloaded from the asset manager’s website. The benchmarks that are used in this research are selected by using the same benchmark stated in the Guggenheim Investments’ fact sheets as the main benchmark. Three more supporting benchmark are selected by using the same category from MSCI, Russel, and S&P. The Fama French and Momentum factor are collect from the data library of Tuck Business School at Dartmouth.
Data Preparation
After the data collection, they were processed via Excel Spreadsheet to apply the formulas in order to evaluate the performance of the funds, as well as several statistics. In addition, the processed data from Excel would be exported to E-View 9 to estimate the regression model to apply CAPM, Fama French and Carhart Model.
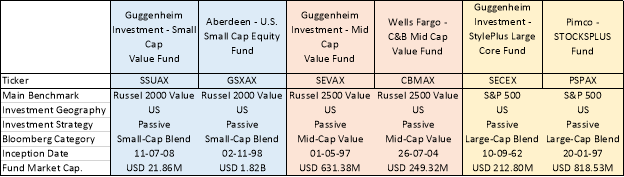
(Table 1 Funds Overview)
According to the funds’ fact sheets, all the fund is passively managed as the fund’s objective is to seek long-term capital appreciation. The funds are also investing only in the United States of America. In this research, I additionally use Bloomberg category to match the characteristic of the funds in order to make a more distinctive and more consistent comparison of the similar funds. The main asset manager in this research is Guggenheim Investment and the comparable funds are from Aberdeen, Wells Fargo, and Pimco.
The tables below show the statistical data of the funds in terms of simple calculated excess return and log calculated excess return. The returns can be calculated as the followings;
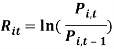
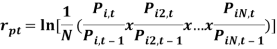
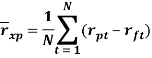
-  The Average Logged Return
The monthly return of the fund and risk-free rate were calculated into logged return in order to calculate time-consistent return.
- The Arithmetic Mean Excess Return
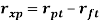
The Arithmetic Mean Excess Return can be calculated by deduct the country risk free rate, in this case US 3-month T-Bill Rate, from the return of the portfolio.

(Table 2: Simple Return Statistic)
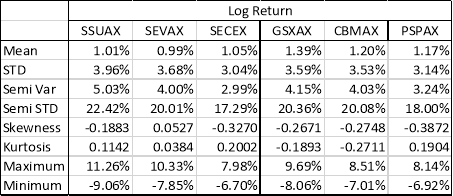
(Table 3 Log Return Statistic)
From the tables, we can observe that the funds from Guggenheim Investment generated lower return than the competitors and also have higher downside risk, which is semi-standard deviation. We will further observe the trend of each fund and its competitor and how it performs against the benchmark in these line graphs.
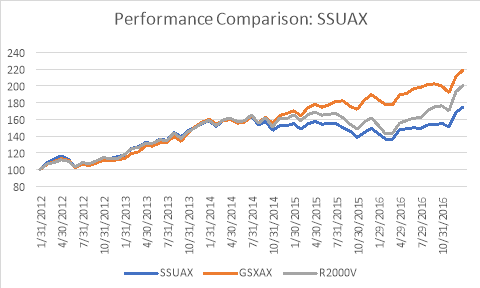
(Figure 1 Performance Comparison: SSUAX)
This line graph above and the following two graphs are calculated by setting the starting point as 100, and then increase exponentially with the excess return in that period. The illustration shows that both SSUAX and GSXAX effectively track the benchmark from the beginning of 2012 to the end of 2014. After that point, SSUAX started to underperform the benchmark and GSXAX started to outperform the benchmark. The trend tends to persist to the present.
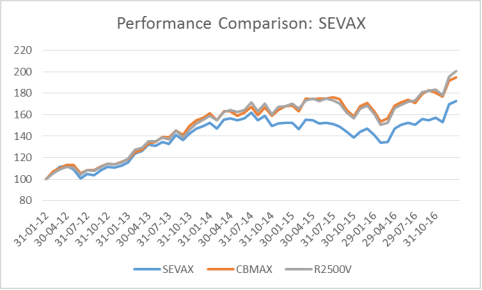
(Figure 2 Performance Comparison: SEVAX)
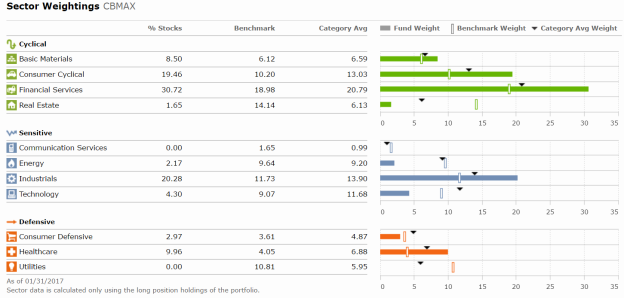
The graph above show the strong underperforming trend of SEVAX, while CBMAX can effectively replicate the benchmark since the starting point of the observations. However, both funds still have the same pattern as the benchmark. This should due to difference in the weight of the assets allocation.
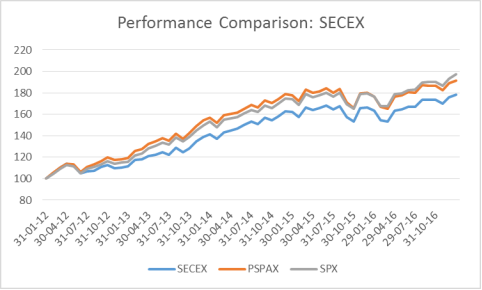
(Figure 3 Performance Comparison: SECEX)
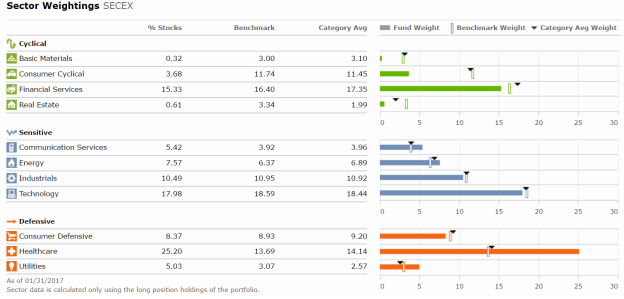
This graph illustrate that PSPAX slightly outperform the benchmark for almost the whole period of the observation, while SECEX still able to replicate the pattern of the benchmark but slightly underperform the benchmark.
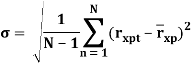
- Standard Deviation and Variance
As the widely used mean dispersion or volatility measurement (Lhabitant, 2006), the variance and standard deviation capture the risk of an investment over time. The larger the dispersion means the greater the value of both variance and standard deviation. With Microsoft Excel, the function STDEV.S() was used to calculate sample standard deviation from the logged return.
- Semi-Variance and Semi-Standard Deviation
Focus only the downside, Semi-Variance and Semi-Standard Deviation present the downside risk of the distribution in term of dispersion to mean.
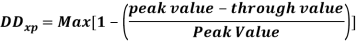
- Drawdown Risk
Maximum Drawdown simply measures the largest percentage change between the peak price and low price during a specific period of an investment.
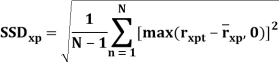
- Shortfall Risk
Shortfall Risk measures the downside risk in term of probability that the downside will occur.
- Value at Risk
The Value at Risk measures the maximum loss that a portfolio can be expected within an observation interval at a specified confidence level – for example 95% or 99%. Within this research, two type of method are introduced, the historical VaR and normal distribution VaR, where the confidence level was specified according to the historical distribution and normal distribution respectively.

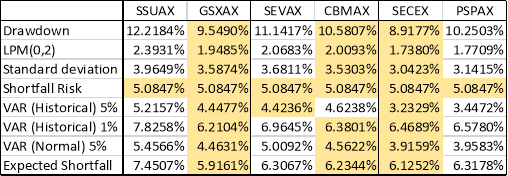
(Table 4 Risk Measurements)
For small-cap and mid-cap funds, Guggenheim Investments tend to suffer from higher risk than its competitors as they have higher values in most of the risk measurements used in this research. On the other hand, the large-cap fund of Guggenheim Investments has better risk management than the competitor in all perspective. These risk measurements will affect the risk rewarding ratios in the next section.
The ratios shown in this analysis can be calculated as the followings,
- Information Ratio

  average excess return of the portfolio over the market benchmark return
  standard deviation of
The ratio is used to compare with the Sharpe Ratio of the asset as the Information Ratio is considered as the benchmark’s Sharpe Ratio. By comparing the asset Sharpe Ratio with Information Ratio, the higher Sharpe Ratio in compare to Information Ratio represent that the asset is outperforming the benchmark (Deborah, 2011).
- Sterling Ratio

 average excess return of the portfolio over the risk free rate
 average minimum drawdown over the observation period
The ratio has similar meaning to reward-to-risk ratio. It is used to measure the ability of the fund manager to control their risk to lower the portfolio drawdown.
The Sterling Ratio as well as the following Burke Ratio are widely advertised by commodity trading advisors, who wish to highlight their perceived skill in letting profits run and cutting losses.
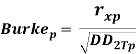
- Burke Ratio
average excess return of the portfolio over the risk free rate
 sum square root of the minimum drawdown over the observation period
The Burke Ratio assumes an investor to experience an increasing instead of a linear incremenal
disutility as reaction to a one unit increase in drawdown.
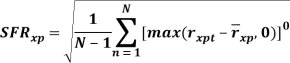
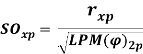
- Sortino Ratio
average excess return of the portfolio over the risk free rate
 semi standard deviation of
This ratio considers the lower partial moment in the second moment, the semi-standard deviation, to measure the risk-premium of the asset in comparison to the downside volatility of that asset.
- Kappa 1
average excess return of the portfolio over the risk free rate
 semi-mean of excess return of the portfolio over the risk free rate
- Kappa 3
average excess return of the portfolio over the risk free rate
 semi-skewness of excess return of the portfolio over the risk free rate
- Treynor Ratio

average excess return of the portfolio over the risk free rate
 sensitivity of the portfolio with the market
The ratio considers the risk premium of the asset in compare to systematic component of an assets risk (Spaulding, n.d.).
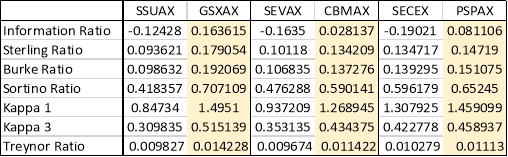
(Table 5 Risk Rewarding Ratios)
From the table above, it is clearly shown that funds from Guggenheim Investment are highly inferior to its competitors in terms of risk rewarding return of every aspects, especially the information ratio, which measure how the fund outperform the benchmark. In this case, all Guggenheim Investment fund have highly negative information ratio, this shows that all the funds are underperformed the benchmark, which further confirmed the graph from previous section.
We can conclude that the small-cap and mid-cap funds of the competitors can outperform the similar funds from Guggenheim Investment mainly because of the better risk management when the higher return further boost the ratios even higher. For the large-cap fund, although fund from Guggenheim Investments has a better risk management, it still suffer from lower return generated by itself, which make its risk rewarding ratios lower than its competitor.
In this research, I run the regression based on the following models using EView,
- The Capital Asset Pricing Model (CAPM)

The CAPM and the SML are included in the research to predict the expected relationship between the risk and return. Using E-View, if the result from model (see appendix ) in term of α_i or Jensen Alpha shows positive and significant, the asset is said to outperform the market benchmark and vice vesa.
- Fama French 3 Factors Model

By applying some market anomalies to support the model, Fama-French Model included the empirical evidence that small stocks could outperform the large stocks and the high book value to market value stocks could also outperform the low ratio stocks. In this research, two factors that were included in addition to the CAPM model are the SMB (Small Minus Big) and HML (High Minus Low).
- Carhart 4 Factors Model

By applying more market anomalies to support the model, Carhart Model included the empirical evidence that the winner security will keep winning and the loser will keep losing, one factors that were included in addition to the Fama French model is the MOM (Momentum).
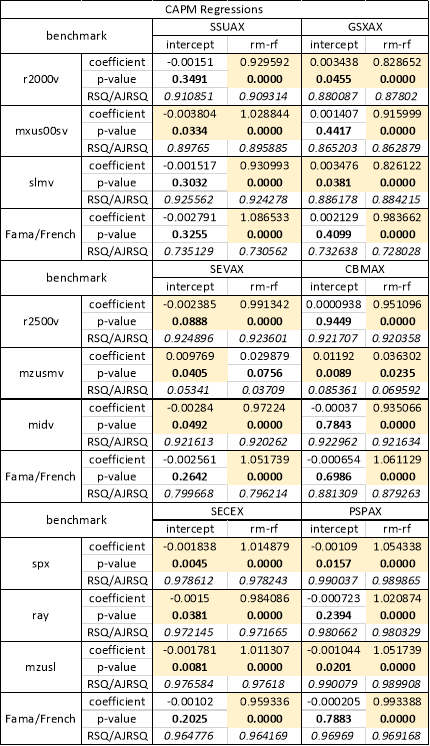
(Table 6 CAPM Regressions)
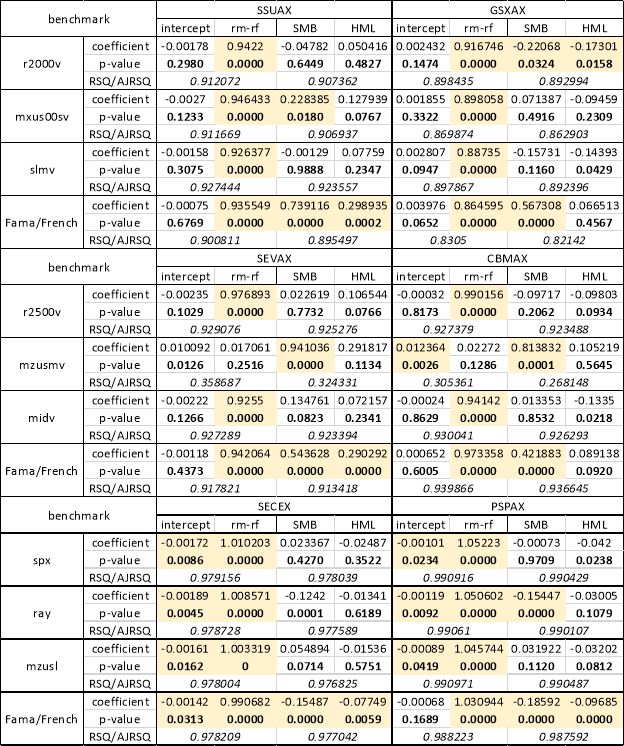
(Table 7 Fama French 3 Factors Regressions)
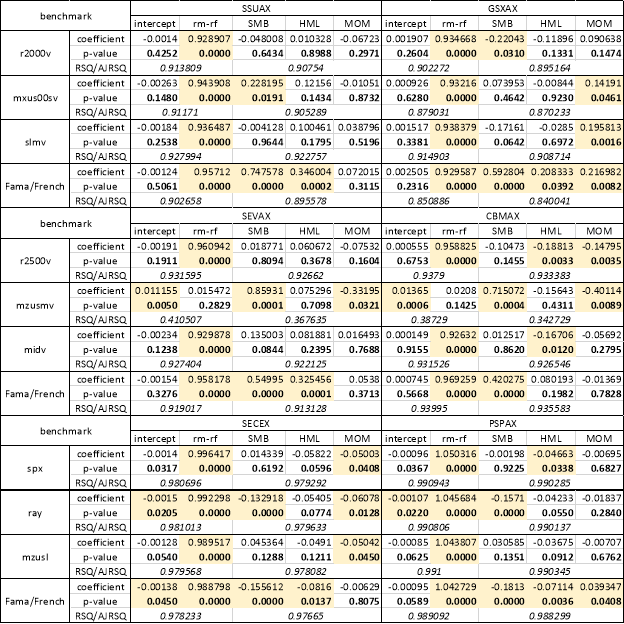
(Table 8 Carhart 4 Factors Regressions)
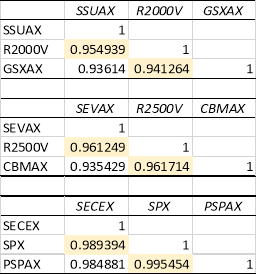
(Table 9 Correlation Matrix)
From the regression tables above, we can see that most of the intercepts of the model are insignificant, indicate that the fund cannot outperform the benchmark. However, there are some intercepts that are statistically significant, but the value of those intercepts are very less likely to deviate from the benchmark, which make the decision whether the fund outperform or underperform the market becomes more difficult.
We can further discuss more about this with the correlation tables, the tables show that the funds, both from Guggenheim Investment and from the competitors, have strong positive correlation (more than 0.95) with its own benchmark. From this point, we can imply that it is very difficult for these funds to outperform or underperform their benchmark due to the highly-correlated characteristic of them. In fact, we can say that these funds are doing well in tracking their benchmark.
For Fama French model regression, the values are mostly significant when regress against its own factors, and not significant when regress with the other benchmarks. Furthermore, the regression results from this model confirm each fund objective and strategy. For SSUAX, the values for SMB are positively significant, which means that the small stocks are dominated in the portfolio, the values for HML are slightly positive and significant, meaning that the value stocks are also in the asset allocation of the funds. The Carhart 4 Factors Model regressions for this fund did not show any significant value for the MOM factor.
As for GSXAX, the regression results are quite not clear, as we have both positively and negatively significant value of SMB and HML in the different regression. I therefore conclude that Fama French 3 Factors Model cannot effectively explain this fund. After using Carhart 4 Factors Model, the result shows the positively significant values for Market Risk Premium, SMB, HML, and MOM. This may conclude that the fund utilize the same strategies as SSUAX, but by following the momentum of the stocks makes this fund outperform SSUAX, which does not utilize the factor.
SEVAX and CBMAX have the similar characteristic to SSUAX and GSXAX, this may due to the funds have closely related choice of investment for being mid-cap and small-cap funds respectively. The regression result still confirm that these two funds mainly invest in small, value stock as SMB and HML are positively significant. However, CBMAX has some evidence of incorporating momentum factor, as the MOM values are negatively significant, indicate that the fund is short selling the loser stocks. This may also help explain why CBMAX outperform SEVAX that does not effectively utilize momentum factor.
SECEX and PSPAX can also be explained by Fama French 3 Factors Model, as the values for SMB and HML factors are all significant, but negatively. This as well confirm the investment strategies of these funds that mainly invest in big-cap stocks that lean toward growth style. We can also determine why PSPAX performs better than SECEX by looking into Carhart 4 Factors Model. PSPAX has positively significant MOM value indicated that it incorporated momentum factor in the strategy when SECEX does not.
Noted that all model has very high level of adjusted r-squared, which means that the estimates are fitted and reliable.
All of the fund from Guggenheim Investments cannot outperform the competitors funds. The funds show poorer risk measurement which result in worse risk rewarding ratio. The regression analysis indicate that the funds also have poorer choice of asset allocation compare with the competitors. The use of Carhart 4 Factors Model clearly shown strong evidence of higher return as seen in the competitors’ funds. In the funds selection, the investors should not only consider the return, but should also consider the level of risk that one is willing to take in order to match each individual risk profile and maximize one’s the utility.
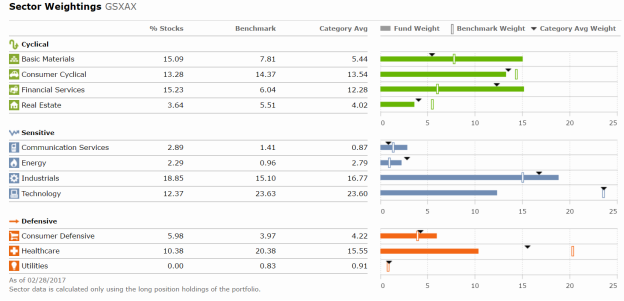
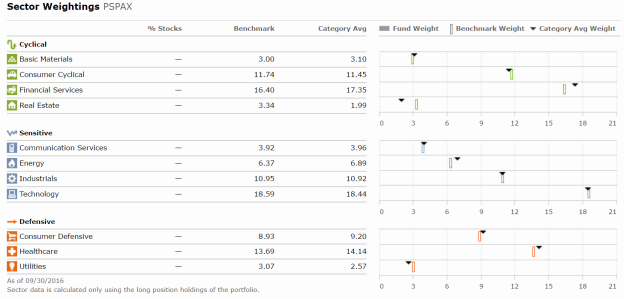
Appendix 1: Fund Fact Sheets
SSUAX
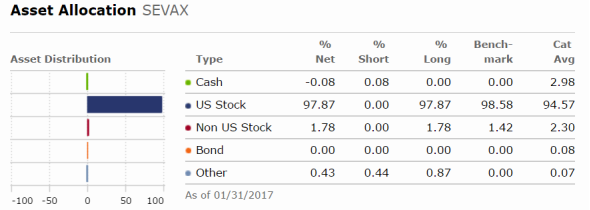
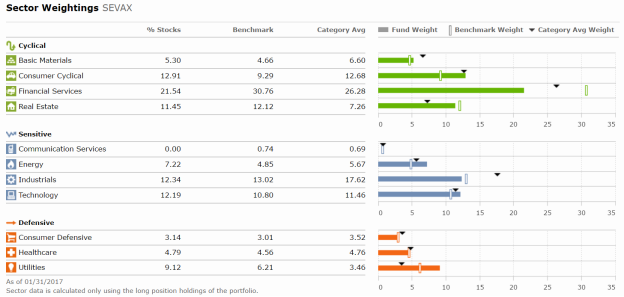
SEVAX
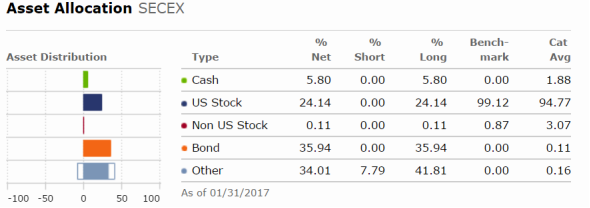
SECEX
GSXAX
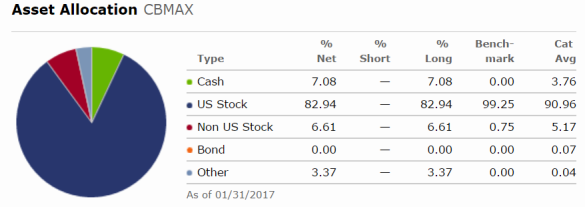
CBMAX
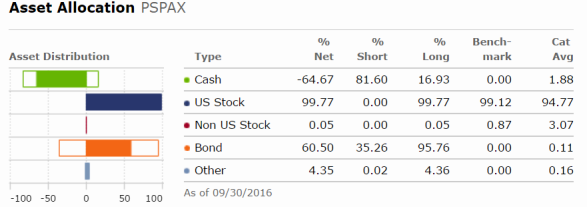
PSPAX
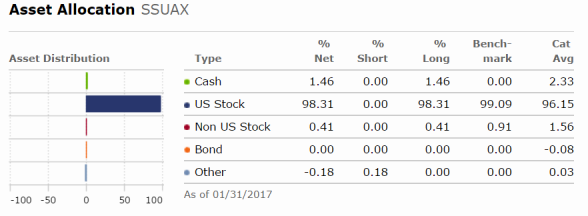
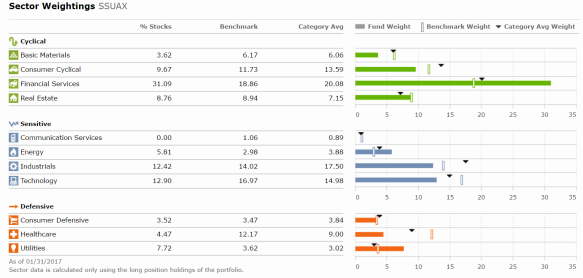
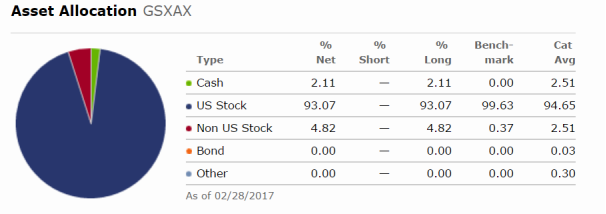
Appendix 2: Assets Allocation
Bodie, Z.; Kane, A. & Marcus, A. (2014) Investments. 10th Edition. New York: McGraw-Hill
Deborah Kidd, CFA (2011). The Sharpe Ratio and the Information Ratio. Online at (accessed on 16-03-2016)
William C. Spaulding (n.d.). Portfolio Performance. Online at (accessed on 16-03-2016)
Lhabitant, F.-S. . (2006) Handbook of Hedge Funds. Chichester: John Wiley & Sons – Chap 19 & 20