Pest Detection on Leafs Using Robot and Processing – Labview
ABSTRACT:
Recent century is a full of technology.
None field can’t remain without the use of the technology. Agriculture is one of those fields. Agriculture is the backbone of India. Most of the scientists are doing research to increase the cultivate of crops. But one problem still exist which is a major concern of the cultivation of crop and that is crop pests.  Due to these problems, The cultivation decreases and hence all the farmers and in turn the country suffers from lack of cultivation of crop.
With the recent advancement in image processing and similar related techniques, it is possible to develop an autonomous system for pest classification. Early detection of pest or the initial presence of a bio aggressor is a key-point for crop management.
If we are able to detect it at the initial stage, we can prevent pest on leaves without spreading all over the field, which reduces the loss of crop and money. In recent years, the development of the robots in agriculture has agriculture introduced. These robots should be capable of working 24 hours a day, in all weather condition.
So if we use robots instead of farmers for detecting the pests on leafs efficiently, we can reduce the loss of crop and money.
KeyWords:Pest detection, LabView, Robot
I.INTRODUCTION
Agriculture is the backbone of India. Most
of the scientists are doing research to increase the cultivity of crops. But one problem still exist which is a major concern of the cultivation of crop and that is crop pests.  Due to these problems, the cultivation decreases and hence all the farmers and in turn the country suffers from
lack of cultivation of crop. Different types of pesticides are there in market which are used to avoid the damage to fruit and vegetable, but the amount of pesticides to be used is not known due to which the cost as well as the environmental pollution gets affected. A strong demand now exists in many countries for non-chemical control methods for pests or diseases. Greenhouses are considered as biophysical systems with inputs, outputs and control process loops. Most of these control loops are automatized (e.g., climate and irrigation control).
However no automatic methods are available which precisely and periodically detect the pests on plants. In fact, in production conditions, periodically  observes plants and search for pests. This manual method is too time consuming. Diagnosis is most difficult task to perform manually as it is a function of a number of parameters such as environment, nutrient, organism etc. With the recent advancement in image processing and similar related techniques, it is possible to develop an autonomous system for pest classification. Early detection of pest or the initial presence of a bio aggressor is a key- point for crop management. The detection of biological objects as small as such insects (dimensions are about 2mm) is a real challenge, especially when considering greenhouses dimensions (10- 100m long). For this purpose different measures are undertaken such as manual observation of plants. This method does not give accurate measures. Hence automatic detection is very much important for early detection of pests. Hence we have to detect the pest at the earlier stage not to spread all over the field.
If we are able to detect it at the initial stage, we can prevent pest on leafs without
Â
spreading all over the field, which reduces the loss of crop and money.In recent years, the development of robots in agriculture has introduced. These robots should be capable of working 24 hours a day, in all weather conditions. So if we use robots instead of farmers for detecting the pests on leafs efficiently, we can reduce the loss of crop and money.
II.LITERATURESURVEY
Recent papers are describing to detect
mainly pests like aphids, whiteflies, thrips, etc using various approaches suggesting the various implementation ways as illustrated and discussed below.
[1] Proposed a cognitive vision system that combines image processing, learning and knowledge-based techniques. They only detect mature stage of white fly and count the number of flies on single leaflet. They used 180 images as test dataset .among this images they tested 162 images and each image having 0 to 5 whitefly pest. They calculate false negative rate (FNR) and false positive rate (FPR) for test images with no whiteflies (class 1), at least one white fly (class 2) and for whole test set.
[2] Extend implementation of the image processing algorithms and techniques to detect pests in controlled environment like greenhouse. Three kinds of typical features including size, morphological feature (shape of boundary), and color components were considered and investigated to identify the three kinds of adult insects, whiteflies, aphids and trips.
[3] Promote early pest detection in green houses based on video analysis. Their goal was to define a decision support system which handles a video camera data. They implemented algorithms for detection of only two bioagressors name as white flies and aphids. The system was able to detect low infestation stages by detecting eggs of white flies thus analyzing behavior of white flies.
[4] Proposed pest detection system including four steps name as color conversion, segmentation, reduction in noise and counting whiteflies. A distinct algorithm name as relative difference in pixel intensities (RDI) was proposed
for detecting pest named as white fly affecting various leaves. The algorithm not only works for greenhouse based crops but also agricultural based crops as well. The algorithm was tested over 100 images of white fly pest with an accuracy of 96%.
[5] Proposed a new method of pest detection and positioning based on binocular stereo to get the location information of pest, which was used for guiding the robot to spray the pesticides automatically.[14] introduced contextual parameter tuning for adaptive image segmentation, that allows to efficiently tune algorithm parameters with respect to variations in leaf color and contrast.
III.EXISTINGSYSTEM
In earlier days in order to detect the pest
on leafs they used early pest detection in green houses based on video analysis. Their goal was to define a decision support system which handles a video camera data. They implemented algorithms for detection of only two bioagressors name as white flies and aphids. The system was able to detect low infestation stages by detecting eggs of white flies thus analyzing behavior of white flies. But this project has many limitations like it is time consuming process and also the output will not get accurately. So in order to eliminate these limitations ,we are going to proposed a system named “pest detection on leafs by using robot and processing in LabVIEW”.
IV.PROPOSEDSYSTEM
In this proposed system we are making
use of robots in order to take the live images from field section to monitoring section. The images taken by the robot processed and the type of disease is displayed accurately. By using this project we can get the output accurately and the type of disease. As we are making use of LabVIEW (Laboratory Virtual Instrumentation Engineering Workbench) software ,in this software instead of text there are making use of icons in order to create the programs. compared to the other softwares this software as many advantages like it will not show any errors at the time of executing the program, whereas other
Â
softwares even a small error is there means we will not get the output showing there is some errors, it eliminates the limitations in the existing system. Once you taken the image and create the class mentioning  the type of samples in LabVIEW, definitely we will get the output mentioning the type of diseases. Workload on farmers is minimized by using these type of system. By making a track for robot it will be worked properly in slippery and unequal surfaces. If we use chain instead of wheels in the field, robot can work more effectively on unequal surface of the field. Farmers don’t have to go in the field because robots do their work properly and effectively. Time consumed by the robots for detecting the pest on leafs is less than mankind, which can work efficiently.
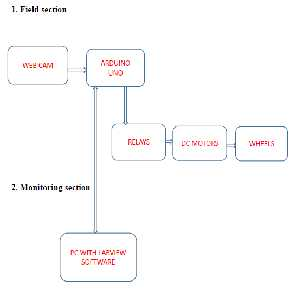
Fig 1:Block Diagram
V.WORKING
In block diagram we are using the web
camera in order to take the live pictures from field section to the monitoring section. We are using high definition web camera model number (jil-2247).This web camera takes the images of affected leaf which are caused due to pests. Generally we prefer this type of web camera because it has high flexibly, as well the cost of this type of web camera is very less. It will send
live pictures from field section to monitoring section up to 10 meters distance. We are using wired web camera and this web camera is connected to system through USB cable. This web camera is generally monitored through the system.
Next we are using Arduino UNO. The Arduino Uno is a Microcontroller board based on the ATmega328 (datasheet).it has 14 digital input/output pins(of which 6 can be used as PWM outputs),6 Analog inputs,16 MHZ crystal oscillator , a USB connection , a power jack , an ICSP header , and a reset button. In this project we are making use of only 4 digital input/output pins (i.e. pin no’s 8, 9, 10, 11), 5v in and Ground pin. These 4 digital pins acts as output pins and also we are making use of 5v output pin as well as ground Pin. Remaining pins we are not using in this project. These 4pins are connected to 4 relays . Relay is nothing more than a switch.
A Relay is an electromechanical switch used for one or more of the four (4) purposes
1. To turn something ON.
2. To turn something or disable something.
3. To change the polarity of a wire.
4. To increase the current supply of a wire. In this project we are using four (4) relays
1. for moving forward
2. for moving backward
3. for moving left side
4. for moving right side
The main use of these four relays is to move the robot either forward, backward, left side, right side. Based on our request, the particular relay will be on and move in particular direction.
These four relays are connected to the two dc motors. In order to work the dc motors we need power supply, so we are using 5v battery. Based on our request the particular relay will be on and this relay will be connected to dc motors and move in a particular direction. Lastly this dc motors are connected to the wheels to rotate
.instead of wheels we can use chains ,this chains can move in even in uneven flat surfaces. This robot take the live pictures from field section to
Â
monitoring section without the use of human effort and it will finds whether the leaf had caused marks and based on the marks it will intimate the type of disease.
VI.SOFTWAREREQUIREMENTS
The following are the software requirements used
in this project
i. Virtual instrumentation ii. LabVIEW
Virtualinstrumentation
Virtual Instrumentation is the use of
customizable software and modular measurement hardware to create user-defined measurement systems, called virtual instruments. The concept of a synthetic instrument is a subset of the virtual instrument concept. A synthetic instrument is a kind of virtual instrument that is purely software defined. A synthetic instrument performs a specific synthesis, analysis, or measurement function on completely generic, measurement agnostic hardware. Virtual instruments can still have measurement specific hardware, and tend to emphasize modular hardware approaches that facilitate this specificity. Hardware supporting synthetic instruments is by definition not specific to the measurement, nor is it necessarily (or usually) modular.
Leveraging commercially available technologies, such as the PC and the analog to digital converter, virtual instrumentation has grown significantly since its inception in the late
1970s. Additionally, software packages like National Instruments’ Lab VIEW and other graphical programming languages helped grow adoption by making it easier for non- programmers to develop systems.
LabVIEW
Lab VIEW (short for Laboratory Virtual
Instrumentation Engineering Workbench) is a platform and development environment for a visual programming language from National Instruments. Originally released for the Apple Macintosh in 1986, Lab VIEW is commonly used for data acquisition, instrument control, and industrial automation on a variety of platforms including Microsoft Windows, various flavors of
UNIX, Linux, and Mac OS. The programming language used in Lab VIEW, is a dataflow language. Execution is determined  by the structure of a graphical block diagram.
LabVIEW programs are called virtual instruments (VIs).Controls are inputs and indicators are outputs.
Each VI contains three main parts:
a. Front panel – How the user interacts with the
VI
b. Block diagram – The code that controls the program
In LabVIEW, you build a user interface by using a set of tools and objects. The user interface is known as the front panel. You then add code using graphical representations of functions to control the front panel objects. The block diagram contains this code. If organized properly, the block diagram resembles a flowchart.
VII.SCHEMATICDIAGRAMSIN LABVIEW
FrontPanel:
When you have created a new VI or
selected an existing VI, the Front Panel and the Block Diagram for that specific VI will appear as shown in below figure
In LabVIEW, you build a user interface, or front panel, with controls and indicators. Controls are knobs, push buttons, dials, and other input devices. Indicators are graphs, LEDs, and other displays.
You build the front panel with controls and indicators, which are the interactive input and output terminals of the VI, respectively. Controls are knobs, push buttons, dials, and other input devices. Indicators are graphs, LEDs, and other displays. Controls simulate instrument input devices and supply data to the block diagram of the VI. Indicators simulate instrument output devices and display data the block diagram acquires or generates.
Â
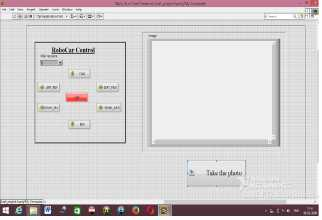
Fig 2: Front Panel
VIII.BLOCKDIAGRAM
After you build the user interface, you add
code using VIs and structures to control the front panel objects. The block diagram contains this code. In some ways, the block diagram resembles a flowchart.
After you build the front panel, you add code using graphical representations of functions to control the front panel objects. The block diagram contains this graphical source code. Front panel objects appear as terminals, on the block diagram. Block diagram objects include terminals, subVIs, functions, constants, structures, and wires, which transfer data among other block diagram objects. It will accompany the program for the front panel which is shown in below figure
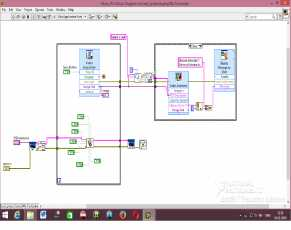
Fig 3: Block Diagram
IX.WORKING VisionAcquisition
In order to detect the pest in leafs, first
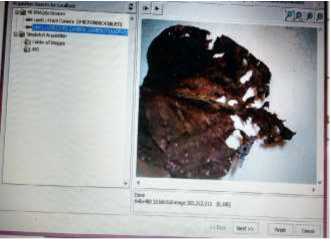 we have to acquire the image (i.e. take the image of any one leaf in the field).for taking the image of the leafs we require one web camera. This web camera sends live picture from field section to the monitoring section. The  below figure shows the image of the affected leaf which was taken from field
Fig4:Acquiringtheimageof theaffected leaf
VisionAssistant
After acquiring the image of the
affected leaf, assist the image (i.e. mentioning the type of the disease).create a class mentioning the type of disease and take the different samples of the image and store these in particular class.
The below figures shows how to create a class, the samples of the different classes and also the samples of the affected leafs created in a particular in a particular class is as shown below
Â
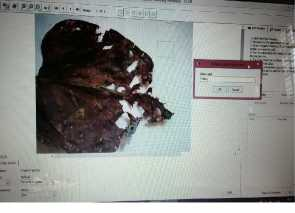
Fig 5: a class of the affected leaf
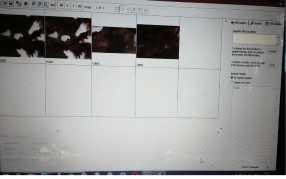
Fig 6: Samples of the affected leaf
RobotControl
After creating a class and storing the
samples of the affected leaf in that particular class, take photo of the another leaf which was affected by same pest in another field with the help of robot by moving either forward, backward, left side, right-side in front panel.
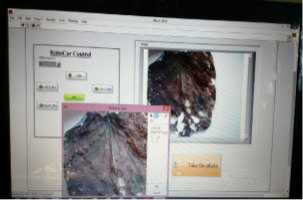 The below figures represents the field section and monitoring section, photo taken in front panel
Fig 7:Image taken with the help of robot
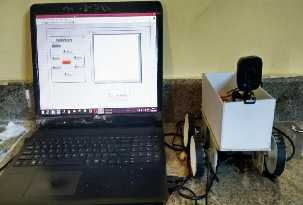
Fig 8: Monitoring section and Field section
RESULT&CONCLUSION
By using this project we can detect the
pest on affected leafs and also we can detect two or more diseases in one particular leaf. after taking the image in front panel ,it will be displayed on the screen as” image is detected and the type of disease is:”.the below figure represents the result of the affected leaf mentioning whether the disease is detected or not.
Figure represents the image taken for the affected leaf with the help of robot and figure represents the output of the image whether the leaf is detected or not: and also the type of disease is as mentioned in the figure
INPUT:
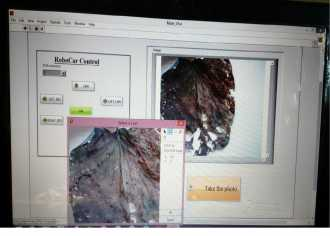
Fig 9: Image taken with the help of robot
Â
OUTPUT
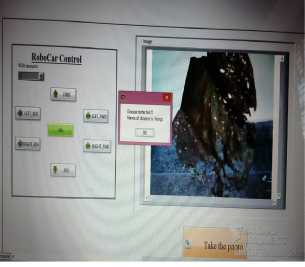
Fig10: screenshot showing the disease of the affected leaf
 We are taking the image of the affected leaf with the help of web camera using robot by  moving  either left side, right side, backward, downward and after processing it finds whether the disease is detected, if it is detected the type of disease is displayed on the screen.
CONCLUSION&FUTURESCOPE
Future scope of this type of robots are
very bright because it is very useful in agriculture and reduce the workload. It reduce the time consumed in spraying the pesticide liquid and works very effectively. It will help the farmers to do work in any season and conditions. It will reduce the danger for the farmers from different breathing and physical problems. This type of robots are being used in bicontrol of avocao posttharvest diseases. This type of robots are used for managing diseases in greenhouse crops as well as many other crops. This type of robots are also used in the
fields to detect the fruit is ripen or not and also used for many other purposes
REFERENCES
[1]. P. Boissard, V. Martin, S. Moisan “A
Cognitive Vision Approach to Early Pest Detection in Greenhouse Crops” Computer and Electronics in Agriculture Journal,
62(2):83-93, April 2008.
[2]. J. Cho, J. Choi “Automatic identification ofwhiteflies,  aphids  and  thrips  in greenhouse based on image analysis” International journal of mathematics and computers in simulation March 27,2007.
[3].  Sanjay B. Patil, Dr. Shrikant K. Bodhe “Leaf disease severity measurement using image Processing” International Journal of Engineering and Technology Vol.3 (5),
2011, 297-301.
[4]. M. T. Maliappis, K. P. Ferentinos, H. C.
Passam And A. B. Sideridis [2008] “Gims: A Web based GreenhouseIntelligent Management System”,World Journal of AGRICLTURAL Sciences 4(5):640-647.
[5]. C. Bauch and T. Rath, “Prototype of a Vision Based System for Measurements of White Fly Infestation”,Institute of Horticultural and Biosystems Engineering, University of Hannover.
[6].  Ganesh Bhadane, Sapana Sharma and Vijay B. Nerkar, “Early Pest Identification in Agricultural Crops using Image Processing Techniques”, International Journal of Electrical, Electronics and Computer Engineering 2(2): 7782(2013).
[7]. Presents an automatic method for classification of the main agents that cause damages to soybean leaflets,i.e., beetles and caterpillars using SVM classifier.[12] proposed Back propagation neural network for recognition of leaves, diseases, pests.