Properties of Phagraphene via Hydrogenation and Fluorination
Modulation of electronic and mechanical properties of phagraphene via hydrogenation and fluorination
Donghai Wu ab, Shuaiwei Wang ab, Jinyun Yuanab* Baocheng Yang ab, Houyang Chenc*
a Institute of Nanostructured Functional Materials, Huanghe Science and Technology College, Zhengzhou, Henan 450006, China
b Henan provincial key laboratory of nanocomposite and application, Zhengzhou, Henan 450006, China
c Department of Chemical and Biological Engineering, State University of New York at Buffalo, Buffalo, New York 14260-4200, USA
________________
Abstract: Recently, a new carbon sheet, phagraphene, was proposed by theoretical calculations [Nano Lett. 2015, 15, 6182]. In this paper, the hydrogenated and fluorinated phagraphene (denoted as H-PHA and F-PHA) sheets have been systematically studied using first-principles calculations. The results of formation energy, ab initio molecular dynamics, phonon dispersion and elastic constants confirm that the modified phagraphene sheets are thermodynamically and dynamically as well as mechanically stable. We find that hydrogenation or fluorination is an effective way to modulate the bandgap, and we also find that adsorption-induced semimetal-semiconductor transition and adsorption-induced semimetal-insulator transition occur. Configuration-dependent bandgap for partially H-PHA and configuration-independent bandgap for fully H-PHA are determined. Adsorption-ratio-dependent bandgaps of H-PHA and F-PHA are also identified. Calculated bandgaps from HSE06 and PBE functionals of fully H-PHA are larger than those of F-PHA, and they are comparable to thehydrogenated/fluorinated penta-graphene while they are larger than their corresponding graphene. Dependence of bandgaps of fully H-PHA and F-PHA on the tensile strain is investigated, and our calculations show that an insulator-semiconductor transition occurs upon increasing the tensile strain. Our results also determined that the mechanical properties are controllable by using hydrogenation and fluorination. The calculations of Young’s modulus and Poisson’s ratio reveal the functionalized phagraphene sheets possess suitable stiffness and resistance to volume deformation, and both are smaller than the pristine phagraphene.
1. Introduction
Two-dimensional (2D) carbon-based materials have been attracting great attention due to their fascinating mechanical, thermal, electronic, optical and magnetic properties.1-11 In particular, graphene is the most representative example. Since synthetized by Novoselov et al.6 in 2004, graphene has been extensively studied for its robust stability,12 high crystal quality,13 captivating mechanical and electronic as well as thermal properties.14-18 The covalently bonded honeycomb lattice with perfect hexagonal symmetry of graphene plays a crucial role in forming Dirac cones,19 which gives graphene massless fermions, resulting in the anomalous quantum Hall effects,20 ultrahigh carrier mobility21 and other properties.22, 23
Recently, a new carbon sheet, phagraphene,19 composed of rings containing five, six, and seven carbon atoms, was proposed by theoretical calculations. It can be considered as a defective graphene.24 This planar carbon allotrope is slightly more unstable than pristine graphene while energetically more favorable than other carbon allotropes.19 The notable stability benefits from its sp2-hybridization and dense atomic packing structure.25 Zhang et al.19 have proven that the electronic structure of phagraphene has direction-dependent Dirac cones, which are robust against external strain with tunable Fermi velocities. This unique performance makes the phagraphene an advanced material for numerous applications in photoelectric technology.
However, like graphene, the phagraphene suffers a major “drawback” of zero bandgap and rather robust gapless state, limiting its potential applications. In order to overcome this disadvantage, we use hydrogenation and fluorination to modulate its bandgap in this paper. Thanks to the surface unsaturated C-C dangling bond,26 the chemical modification by adsorbing non-carbon atoms on the surface is an effective way to create a bandgap and tune the electronic, magnetic and mechanical properties of graphene.14, 24, 26-32 Hydrogenation is not only the simplest and manageable adsorption but also the generating hydrides are promising hydrogen storage materials in energy field.33, 34 The fluorine atoms with ultrahigh electronegativity are adsorbed on the graphene surface forming fluorinated graphene, which have been investigated experimentally and theoretically.14, 35, 36 After adsorbing such atoms, the forming C-H and C-F bonds could give rise to the carbon atoms transforming their hybridization state from sp2 to sp3, 33 correspondingly, the structural and electronic properties would undergo dramatic alterations.
In this work, by employing first-principles calculations, the effect of hydrogenation and fluorination on the bandgap opening of phagraphene sheet is examined. After hydrogenation or fluorination, the bandgap of phagraphene could be opened sizably, changing its electro-conductivity from Dirac semimetal to semiconductor or from Dirac semimetal to insulator. The structural stability and mechanical properties of the modified phagraphene sheet are also investigated.
2. Computational details
All the first-principles calculations and abinitio molecular dynamics (AIMD) were carried out by density functional theory (DFT) with the projector augmented wave (PAW) method and performed by the Vienna abinitio simulation package (VASP)37 . The 2D periodic boundary condition was adopted and a vacuum space of 20 Å along the perpendicular direction of the phagraphene sheet was included in order to avoid the interactions between adjacent layers. The generalized gradient approximation (GGA) of Perdew, Burke, and Ernzerhof (PBE)38 was applied as the exchange-correlation functional in most of the calculations. Meanwhile, to accurately calculate the band structures, the hybrid Heyd-Scuseria-Ernzerhof (HSE06)39 was introduced. The Brillouin zone (BZ) was sampled using 2Ï€ Ã- 0.01 Å−1 Monkhorst-Pack40 k-point mesh density, and the plane-wave basis set with cutoff energy of 600 eV was adopted. The total energy difference of 10−5 eV and force tolerance of 10−2 eV•Å−1 were used for the convergence criteria of geometric optimization and self-consistent field. The phonon properties were calculated by the Phonopy package41 with force constants obtained by the finite displacement method.42
3. Results and discussion
3.1 Structural properties
Figure 1 displays the structure of phagraphene19 together with its hydride and fluoride. The hydrogenated or fluorinated phagraphene (denoted as H-PHA or F-PHA) sheet is obtained by adsorbing hydrogen or fluorine atoms on both sides of the plane. For fully H-PHA and F-PHA, the ratio of C : H/F is 1 : 1. After optimization, the structures of both fully H-PHA (Figure 1c) and fully F-PHA (Figure 1d) are greatly distorted compared to pristine phagraphene (Figure 1a), resulting in low symmetry with a space group of P21/m (No. 11). The 5-6-7 carbon rings no longer remain in the same plane and become crumpled. The buckling height hb (i.e. the height between the bottom and top carbon layers) of fully H-PHA (0.856 Å, see Table 1) is larger than that of F-PHA (0.704 Å), and they are much larger than those of hydrogenated/fluorinated penta-graphene (0.42/0.40 Å) and graphene (0.46/0.49 Å).12The calculated C-C bond distances of pristine phagraphene in Table 1 are in agreement with previous calculations,19 indicating the computational method is valid. All the C-C bond distances in fully H-PHA and fully F-PHA are enlarged compared to the pristine phagraphene, and are close to that of 1.546 Å in diamond43 while larger than that of 1.42 Å in graphene.1 These facts indicate the C-C bonds of phagraphene transform from the sp2-hybridization double bond to the sp3 single bond by hydrogenation or fluorination. The C-C bonds of fully F-PHA are longer than those of fully H-PHA, which can be explained by the depopulation of bonding orbitals between carbon atoms.27 The depopulation of these bonding orbitals stems from the electron transfer between carbon and hydrogen/fluorine atoms. The C-C bonds (C4-C4′ in Figure 1) connecting the adjacent 5- and 7-carbon rings are enlarged to a greater extent than others, which is because of the repulsive interactions and steric effects between the adjacent two H/F atoms in the same side of phagraphene. The C-H and C-F bond distances are approximately 1.11 and 1.38 Å (Table S1), approaching to the typical hydrocarbon and fluorocarbons compounds.44 Similar structure distortions and C-C bond elongation are found in hydrogenated/fluorinated penta-graphene and graphene.12, 26, 44
3.2 Stability analysis
To investigate the stability of H-PHA and F-PHA, the binding energy Eb and formation energyEf are calculated (definitions of Eb and Ef are given at Section S1 of Supporting Information). The values of Eb are -2.540 and -2.977 eV/atom for fully H-PHA and fully F-PHA (see Table 1), respectively, implying strong interactions between C and H/F. A possible explanation of the strong attractive interactions between C atoms (of phagraphene) and H/F atoms is that, by adsorbing H/F atoms, the C-H/C-F bonds are formed, and the C-C bonds of phagraphene elongate greatly, which could partially release the stress imposed by the 5-6-7 carbon rings.12 Another important factor for synthesis is the formation energy, which applies to measure the stability against molecular desorption from the surface.44 The negative Ef (-0.276 eV/atom for fully H-PHA and -1.615 eV/atom for fully F-PHA) means that the surface modification is exothermic process and the H-PHA (or F-PHA) has lower energy than that of pristine phagraphene and H2 (or F2) molecules. The Eb and Ef of hydride are larger than those of fluoride, which are in accordance with similar systems of hydrogenated/fluorinated graphene (-2.48 eV > -2.86 eV)27 and penta-graphene (-3.65 eV > -4.22 eV).12 It is noticed that the Eb of fully H-PHA and fully F-PHA are close, whereas the Ef of fully H-PHA and fully F-PHA have huge difference. This is because of large difference in the dissociation energy of H2 and F2 molecules.27
The thermal stability is also important for H-PHA and F-PHA and is evaluated using the AIMD simulations with a 2 Ã- 2 Ã- 1 supercell and a time step of 1 fs for 5000 steps at room temperature (300 K) and 1000 K. Temperature (T) and total energy (Et) as functions of simulation time are plotted in Figures 2 and S1. T and Et converge to constants and the fully H-PHA and F-PHA keep their integrated structures during the AIMD simulations at the setting temperature. These facts demonstrate that hydrogenated or fluorinated phagraphene not only possesses robust thermal stability at room temperature, but also is resistant to high temperature such as 1000 K.
In order to examine the dynamic stability, the phonon dispersion curves along the high symmetry points in the BZ and the corresponding phonon density of states (PDOS) are calculated (Figure 3). No imaginary frequencies are found for both fully H-PHA and fully F-PHA, demonstrating that they are dynamically stable. There are three obvious acoustic modes in the bottom of the phonon spectra for the two structures, and the double degenerates arise along the X–Z path of the BZ. These features are similar to the pristine phagraphene,19 graphene45 and its derivatives.12 From the PDOS, one can see that the H-PHA has a tremendous phonon gap of approximately 40 THz, while it is small for F-PHA (about 3 THz). The vibration frequency is inversely proportional to the effective atomic mass,12 thus the larger phonon gap of H-PHA than F-PHA may be attributed to the much lighter atomic mass of hydrogen than fluorine atom. Meanwhile, the narrow high frequency zone around 87 THz in Figure 3a is corresponding to the C-H bond vibration modes of H-PHA, in accordance with the case of hydrocarbon.46 These C-H stretching modes are infrared active and useful in characterizing this compound.44 The low frequency range from 5 to 10 THz in Figure 3b mainly consists of the phonon modes of C-F bonds. The middle frequency range is dominated by the motion of C atoms. The C=C double bonds were broken by hydrogenation/fluorination, resulting in the disappearance of C-C vibration modes in the region of 40-50 THz for pristine phagraphene.19
3.3 Electronic structures
In order to explore the electronic properties and bonding features, the band structures and density of states (DOS) of partially and fully hydrogenated/fluorinated phagraphene are calculated using both PBE and HSE06 functionals.
As an example for partially H-PHA, 60% hydrogenation of phagraphene is chosen and four stable configurations (see Figure S2) are designed. The band structures of these configurations are shown in Figures 4 and S3. One can see that the band structures disperse greatly to single band, leading to the sharp peak appearing in the DOS at the EF. Meanwhile, a sub-bandgap located below or above the primary bandgap was observed. From calculations with PBE functional (Figure S3), the bandgaps of the four configurations vary from 2.65 eV (Figure S3a) to 1.72 eV (Figure S3b) to 0.93 eV (Figure S3c) to 0 (Figure S3d). The PBE functional usually underestimates the bandgap of materials.12 To obtain a more accurate Egap, the hybrid functional HSE06 is adopted. The calculated bandgaps with HSE functional in Figure 4 are 3.70 eV, 2.46 eV, 1.56 eV and 0.54 eV for the four configurations. Thus, one can conclude that the bandgap of partially hydrogenated phagraphene depends on configuration and adsorption-induced semimetal-semiconductor transition occurs. Such a functionalized 2D material with a proper bandgap has promising applications in optoelectronics and microelectronics.29, 47
The band structures and DOS of fully H-PHA and fully F-PHA are shown in Figures 5 and S4. From calculations with PBE functional (Figure S4), fully H-PHA and F-PHA have direct bandgaps of 4.29 eV and 3.23 eV, respectively. To examine the influence of configuration on the electronic properties, another four configurations of fully hydrogenated phagraphene (see Figure S5) are taken into account. The calculated band structures of the five configurations (Figures S4a and S6) are almost the same and the bandgaps are approximately 4.29 eV, indicating that the Egap of fully hydrogenated phagraphene is independent of the configuration. Similar behavior was found for fully hydrogenated graphene.27 We also calculated the band structures and DOS with HSE06 functional (Figure 5), and obtained that Egap for fully H-PHA and fully F-PHA are 5.37 and 4.98 eV, respectively. These values are comparable to the Egap of hydrogenated/fluorinated penta-graphene (5.35 eV and 4.78 eV) while they are larger than those of corresponding graphene (4.97 eV and 4.74 eV).12 Obviously, the Egap of F-PHA is smaller than that of H-PHA. Similar results are found in cases of hydrogenated/fluorinated graphene26, 27 and penta-graphene.12Compared to the pristine phagraphene with zero bandgap, the surface modification via hydrogenation or fluorination can effectively tune its electronic structure from semimetal to insulator. Analysis of the partial DOS (Figure 5) reveals that, for H-PHA, the electronic states near the Fermi level (EF) are primarily originated from the C atoms, while they are dominated by both C and F atoms for F-PHA. Additional, from Figures 4 and 5, one can conclude that the bandgaps of H-PHA and F-PHA depend on the adsorption ratio of H and F atoms.
We also examine the effect of strain on the band structures. The obtained stress-strain curves of fully H-PHA and F-PHA under biaxial loading (Figure S7) show that their fracture strains are 0.17 and 0.13, respectively. By changing the biaxial tensile strain, the bandgaps of fully H-PHA and F-PHA remain the direct gaps (Figures S8 and S9). Furthermore, upon increasing the biaxial tensile strain, the bandgap of fully H-PHA increases first and then decreases (Figure 6a), whereas the bandgap of fully F-PHA decreases monotonically (Figure 6b). These behaviors indicate that bandgaps depend on the strain. Strain-dependent bandgaps of other 2D materials were also determined previously.48-52 More interestingly, our calculations show that the bandgap of H-PHA reduces from 5.62 eV (ε = 0.10) to 4.42 eV (ε = 0.17) and the bandgap of F-PHA decreases from 4.98 eV (ε = 0) to 3.01 eV (ε = 0.13), indicating that an insulator-semiconductor transition occurs with the tensile strain changes.
To visually describe the electronic structure of fully H-PHA and F-PHA, we calculate the charge density. As shown in Figure 7, the charges are redistributed after hydrogenation or fluorination. Compared to the charge densities of C=C bonds in pristine phagraphene (see Figure S10), the charge densities of C-C bonds in H-PHA and F-PHA are reduced. For H-PHA, the shared charges donated by hydrogen are mainly located between the carbon and hydrogen atoms. For F-PHA, a large number of charges are focused on the fluorine atoms. This difference is a consequence of the different electronegativity of hydrogen and fluorine. For a selected element, its attraction of electrons becomes stronger with higher electronegativity.53, 54 The electronegativity increases gradually from hydrogen to carbon to fluorine.53 Thus the charge transfer is from hydrogen to carbon atoms in H-PHA while it is from carbon to fluorine atoms in F-PHA, which is consistent with other hydrocarbons and fluorocarbons.12, 55-57 Moreover, the charge density between H and C is lower than that between F and C, implying the weaker C-H interaction than C-F. The Mulliken population analysis58 shows that the transfer charge amounts are approximately 0.22 and 0.33 electrons for H-PHA and F-PHA, respectively, manifesting the weaker bond strength of C-H than that of C-F.
Since the ultrathin 2D phagraphene as well as its derivatives is susceptible to external influences, including mechanical deformation,24it is necessary to develop an in-depth understanding of their mechanical properties for practical application. The elastic constants are calculated (definitions are given at Section S2 of Supporting Information) and the obtained results are tabulated in Table 2, together with the existing reference data24 for comparison. All the elastic constants of fully H-PHA and fully F-PHA satisfy the mechanical stability criteria of C11C22 − C122 > 0 and C66 > 0 for 2D sheets,3, 59 indicating that they are mechanically stable. The in-plane Young’s modulus (E) and Poisson’s ratio (ν) can be derived from the elastic constants using the formulas of E = (C112 − C122) / C11 and ν = C12 / C11.24 The E of fully H-PHA and F-PHA are 151.3 and 176.3 N/m (see Table 2), respectively, which are consistent with the results from the stress-strain curves (149.2 and 178.5 N/m for fully H-PHA and F-PHA, respectively). The Poisson’s ratio ν of fully H-PHA and F-PHA are 0.078 and 0.152, respectively. Because the larger E implies the stronger stiffness and the larger Poisson’s ratio signifies the stronger incompressibility,24 the F-PHA has better stiffness and resistance to volume compression than the H-PHA, which may ascribe to the stronger C-F bonds than C-H bonds. Compared to pristine phagraphene, the E and ν of H-PHA and F-PHA are significantly reduced. Such reduction may be related to their different charge density distribution and bond nature.12, 24
4. Conclusions
In summary, we systematically study the structure, stability, electronic and mechanical properties of hydrogenated and fluorinated phagraphene sheets. Our results show that H-PHA and F-PHA are thermodynamically and dynamically as well as mechanically stable. The binding energy and formation energy of fully F-PHA are smaller than those of fully H-PHA, implying the stronger stability of F-PHA than H-PHA. After hydrogenation or fluorination, the bandgap of phagraphene is opened properly, resulting in an adsorption-induced semimetal-semiconductor transition or adsorption-induced semimetal-insulator transition. Strain-induced insulator-semiconductor transition is also identified. Our band structures demonstrate that bandgap of fully H-PHA is insensitive to the configuration whereas the bandgap of partially H-PHA is sensitive to the configuration. Adsorption-ratio-dependent of H-PHA and F-PHA is also determined. The obtained bandgaps from both PBE and HSE06 functionals of fully F-PHA are smaller than fully H-PHA. The charges are transferred from hydrogen to carbon atoms in the fully H-PHA while it is from carbon to fluorine atoms in the fully F-PHA. The positive Poisson’s ratios of fully H-PHA and F-PHA manifest that they can well resist the volume deformation.Both the Young’s moduli and Poisson’s ratios of the two phagraphene derivatives are significantly smaller than the pristine phagraphene. This investigation suggests that hydrogenation or fluorination is an effective strategy to modulate the electronic and mechanical properties of phagraphene for its possible applications in nanoelectronics.
Acknowledgements
The authors acknowledge the National Natural Science Foundation of China (21401064, 21206049 and 51472102), the Natural Science Foundation of the Education Department of Henan Province (15A150060), the National Natural Science and Henan Province United Foundation of China (U1204601), Special Program for Applied Research on Super Computation of the NSFC-Guangdong Joint Fund (the second phase), and Leading Talents for Zhengzhou Science and Technology Bureau (Grant No. 131PLJRC649) for supports. We thank the National Supercomputer Center in Guangzhou and the High performance Computing Center of Huanghe Science and Technology College for the computer time provided.
References
1.A. H. Castro Neto, F. Guinea, N. M. R. Peres, K. S. Novoselov and A. K. Geim, Rev. Mod. Phys., 2009, 81, 109-162.
2.D. Malko, C. Neiss, F. Viñes and A. Görling, Phys. Rev. Lett., 2012, 108, 086804.
3.S. Zhang, J. Zhou, Q. Wang, X. Chen, Y. Kawazoe and P. Jena, Proc. Natl. Acad. Sci., 2015, 112, 2372-2377.
4.Y. Liu, G. Wang, Q. Huang, L. Guo and X. Chen, Phys. Rev. Lett., 2012, 108, 225505.
5.L. Xu, R. Wang, M. Miao, X. Wei, Y. Chen, H. Yan, W. Lau, L. Liu and Y. Ma, Nanoscale, 2014, 6, 1113-1118.
6.K. S. Novoselov, A. K. Geim, S. V. Morozov, D. Jiang, Y. Zhang, S. V. Dubonos, I. V. Grigorieva and A. A. Firsov, Science, 2004, 306, 666-669.
7.S. Wang, Z. Fan, Y. Cui, S. Zhang, B. Yang and H. Chen, Carbon, 2017, 111, 486-492.
8.Y. Liu, C. Hu, J. Huang, B. G. Sumpter and R. Qiao, J. Chem. Phys., 2015, 142, 244703.
9.Y. Liu, S. T. Huxtable, B. Yang, B. G. Sumpter and R. Qiao, J. Phys. Condens. Matter, 2014, 26, 502101.
10.S. Wang, Y. Si, J. Yuan, B. Yang and H. Chen, Phys. Chem. Chem. Phys., 2016, 18, 24210-24218.
11.Y. Liu, J. Huang, B. Yang, B. G. Sumpter and R. Qiao, Carbon, 2014, 75, 169-177.
12.X. Li, S. Zhang, F. Wang, Y. Guo, J. Liu and Q. Wang, Phys. Chem. Chem. Phys., 2016, 18, 14191-14197.
13.A. K. Geim and K. S. Novoselov, Nat. Mater., 2007, 6, 183-191.
14.P. V. Medeiros, A. J. Mascarenhas, F. de Brito Mota and C. M. de Castilho, Nanotechnology, 2010, 21, 485701.
15.M. I. Katsnelson, Mater. Today, 2007, 10, 20-27.
16.N. Tombros, C. Jozsa, M. Popinciuc, H. T. Jonkman and B. J. van Wees, Nature, 2007, 448, 571-574.
17.S. Wang, B. Yang, S. Zhang, J. Yuan, Y. Si and H. Chen, ChemPhysChem, 2014, 15, 2749-2755.
18.B. Yang, S. Wang, Y. Guo, J. Yuan, Y. Si, S. Zhang and H. Chen, RSC Adv., 2014, 4, 54677-54683.
19.Z. Wang, X. Zhou, X. Zhang, Q. Zhu, H. Dong, M. Zhao and A. R. Oganov, Nano Lett., 2015, 15, 6182-6186.
20.K. I. Bolotin, F. Ghahari, M. D. Shulman, H. L. Stormer and P. Kim, Nature, 2009, 462, 196-199.
21.K. I. Bolotin, K. J. Sikes, Z. Jiang, M. Klima, G. Fudenberg, J. Hone, P. Kim and H. L. Stormer, Solid State Commun., 2008, 146, 351-355.
22.J. Wang, S. Deng, Z. Liu and Z. Liu, Natl. Sci. Rev., 2015, 2, 22-39.
23.N. O. Weiss, H. Zhou, L. Liao, Y. Liu, S. Jiang, Y. Huang and X. Duan, Adv. Mater., 2012, 24, 5776-5776.
24. H. Sun, S. Mukherjee and C. V. Singh, Phys. Chem. Chem. Phys., 2016, 18, 26736-26742.
25.S. W. Cranford, Carbon, 2016, 96, 421-428.
26.J. Zhou, M. Wu, X. Zhou and Q. Sun, Appl. Phys. Lett., 2009, 95, 103108.
27.O. Leenaerts, H. Peelaers, A. D. Hernández-Nieves, B. Partoens and F. M. Peeters, Phys. Rev. B, 2010, 82, 195436.
28.Y. Liu, Z. Chen, L. Tong, J. Zhang and D. Sun, Comp. Mater. Sci., 2016, 117, 279-285.
29.F. Karlický, K. Kumara Ramanatha Datta, M. Otyepka and R. ZboÅ™il, ACS Nano, 2013, 7, 6434-6464.
30.S. P. Lonkar, Y. S. Deshmukh and A. A. Abdala, Nano Res., 2014, 8, 1039-1074.
31.F. Zheng and C. Zhang, Nanoscale Res. Lett., 2012, 7, 422.
32.C. Zhang and S. Yan, J. Phys. Chem. C, 2012, 116, 4163-4166.
33.D. Yi, L. Yang, S. Xie and A. Saxena, RSC Adv., 2015, 5, 20617-20622.
34.M. Pumera, Energ. Environ. Sci., 2011, 4, 668-674.
35.D. W. Boukhvalov and M. I. Katsnelson, J. Phys. Condens. Matter, 2009, 21, 344205.
36.S. B. Bon, L. Valentini, R. Verdejo, J. L. Garcia Fierro, L. Peponi, M. A. Lopez-Manchado and J. M. Kenny, Chem. Mater., 2009, 21, 3433-3438.
37.G. Kresse and J. Furthmüller, Phys. Rev. B, 1996, 54, 11169.
38.J. P. Perdew, K. Burke and M. Ernzerhof, Phys. Rev. Lett., 1996, 77, 3865.
39.J. Heyd, G. E. Scuseria and M. Ernzerhof, J. Chem. Phys., 2003, 118, 8207-8215.
40.H. J. Monkhorst and J. D. Pack, Phys. Rev. B, 1976, 13, 5188.
41.A. Togo and I. Tanaka, Scripta Mater., 2015, 108, 1-5.
42.E. E. Vdovin, A. Mishchenko, M. T. Greenaway, M. J. Zhu, D. Ghazaryan, A. Misra, Y. Cao, S. V. Morozov, O. Makarovsky, T. M. Fromhold, A. Patane, G. J. Slotman, M. I. Katsnelson, A. K. Geim, K. S. Novoselov and L. Eaves, Phys. Rev. Lett., 2016, 116, 186603.
43.P. Rivero, W. Shelton and V. Meunier, Carbon, 2016, 110, 469-479.
44.J. O. Sofo, A. S. Chaudhari and G. D. Barber, Phys. Rev. B, 2007, 75, 153401.
45.C. Si, W. Duan, Z. Liu and F. Liu, Phys. Rev. Lett., 2012, 109, 226802.
46.S. Sakong and P. Kratzer, J. Chem. Phys., 2010, 133, 054505.
47.F. Schwierz, Nat. Nanotechnol., 2010, 5, 487-496.
48.Y. Wang, W. Ji, C. Zhang, P. Li, F. Li, P. Wang, S. Li and S. Yan, Appl. Phys. Lett., 2016, 108, 073104.
49.R. Zhang, C. Zhang, W. Ji, P. Li, P. Wang, S. Li and S. Yan, Appl. Phys. Lett., 2016, 109, 182109.
50.R. Zhang, W. Ji, C. Zhang, S. Li, P. Li and P. Wang, J. Mater. Chem. C, 2016, 4, 2088-2094.
51.H. Zhao, C. Zhang, W. Ji, R. Zhang, S. Li, S. Yan, B. Zhang, P. Li and P. Wang, Sci. Rep., 2016, 6, 20152.
52.R. Zhang, C. Zhang, W. Ji, S. Li, S. Hu, S. Yan, P. Li, P. Wang and F. Li, New J. Phys., 2015, 17, 083036.
53.K. Li and D. Xue, J. Phys. Chem. A, 2006, 110, 11332-11337.
54.R. G. Pearson, Inorg. Chem., 1988, 27, 734-740.
55.H. A. Bent, Chem. Rev., 1961, 61, 275-311.
56.D. M. Lemal, J. Org. Chem., 2004, 69, 1-11.
57.D. O’Hagan, Chem. Soc. Rev., 2008, 37, 308-319.
58.M. D. Segall, R. Shah, C. J. Pickard and M. C. Payne, Phys. Rev. B, 1996, 54, 16317.
59.Y. Ding and Y. Wang, J. Phys. Chem. C, 2013, 117, 18266-18278.
Figure 1. Top and side views of optimized pristine phagraphene (a), and the schematic initial structure of fully H-PHA/F-PHA (b). The red and blue shades represent the adsorbates (H/F) above and below the plane, respectively. Top and side views of the optimized fully H-PHA (c) and fully F-PHA (d).
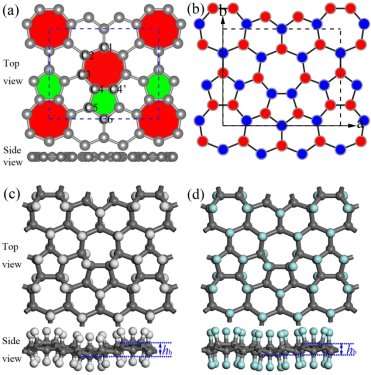
Figure 2. Fluctuations of T and Et for fully H-PHA (a) and fully F-PHA (b) at 1000 K. Inserts are the final structures at the setting temperature.
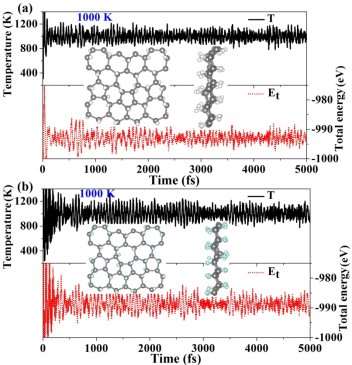
Figure 3. The phonon spectra and PDOS of fully H-PHA (a) and fully F-PHA (b). The inset in (a) is the high symmetry point paths of Г(0, 0, 0), Χ(0.5, 0, 0), Ò®(0, 0.5, 0) and Î-(0.5, 0.5, 0).

Figure 4. Band structures and total DOS of 60% hydrogenated phagraphene from HSE06 functional. (a)-(d) correspond to the configurations in Figure S2(a)-(d), respectively.
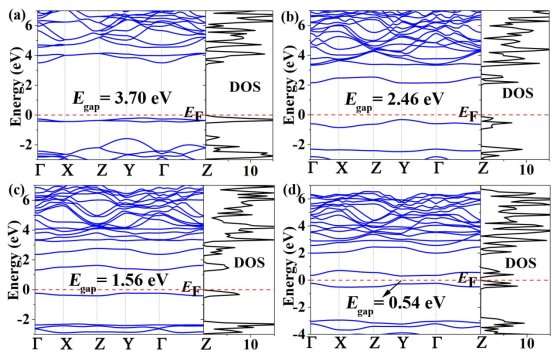
Figure 5. Band structures and DOS of fully H-PHA (a) and fully F-PHA (b) calculated with HSE06 functional.

Figure 6. The bandgaps Egap of fully H-PHA (a) and fully F-PHA (b) as functions of tensile strain ε using the HSE06 functional.
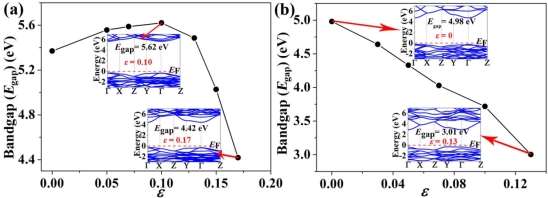
Figure 7. The charge density distributions of fully H-PHA (a) and fully F-PHA (b). The yellow isosurface represents the charge density of 0.25 electron•Ŗ3.
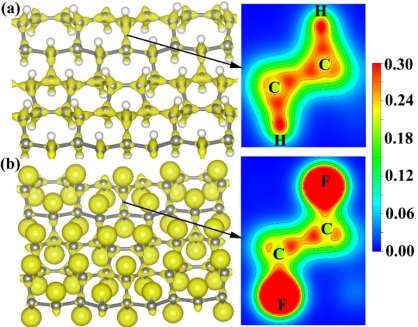
Table 1. The C-C bond distance dC-C, buckling height hb, binding energy Eb and formation energy Ef of fully H-PHA and F-PHA. (values in the parenthesis are from Ref.19)
|
H-PHA |
F-PHA |
PHA |
|
|
dC1-C2 (Å) |
1.581 |
1.685 |
1.520 (1.518) |
|
dC2-C3 (Å) |
1.516 |
1.583 |
1.442 (1.442) |
|
dC3-C4 (Å) |
1.515 |
1.581 |
1.408 (1.416) |
|
dC4-C5 (Å) |
1.526 |
1.584 |
1.431 (1.437) |
|
dC5-C6 (Å) |
1.490 |
1.546 |
1.401 (1.400) |
|
dC4-C4′ (Å) |
1.531 |
1.608 |
1.404 (1.395) |
|
hb (Å) |
0.856 |
0.704 |
0 |
|
Eb (eV/atom) |
-2.540 |
-2.977 |
– |
|
Ef (eV/atom) |
-0.276 |
-1.615 |
– |
Table 2. Elastic constants Cij, Young’s modulus E, Poisson’s ratio ν, ultimate strength σand fracture strain εof fully H-PHA and F-PHA, together with pristine phagraphene (PHA) and graphene (GRA).
|
H-PHA |
F-PHA |
GRAc |
||
|
152.2 |
180.5 |
313.2 |
||
|
C12 (N/m) |
11.9 |
27.5 |
79.7 |
60.4 |
|
C22 (N/m) |
206.7 |
188.5 |
328.9 |
358.1 |
|
90.2 |
79.1 |
– |
– |
|
|
E (N/m) |
292.9 |
348.0 |
||
|
E (N/m) |
149.2 b |
178.5 b |
– |
– |
|
ν |
0.255 |
0.169 |
||
|
σ(N/m) |
16.0 |
12.4 |
24.8 |
32.0 |
|
ε |
0.17 |
0.13 |
0.16 |
0.22 |
a The Young’s modulus is derived from the elastic constants. See section 3.4 for details.
b The Young’s modulus is calculated from the stress-strain curve in Figure S7.
c reference 24.