Risk Factors of Asthma
Table of Contents (Jump to)
Introduction:
Asthma has been one of the common disease of today, there is about one in 15 people has asthma in the world. Asthma is a chronic condition whose symptoms are attacks of wheezing, breathlessness, chest tightness, and coughing. There is no cure for asthma, but most people can control the condition and lead normal, active lives. This report we will be investigating the factors of asthma and also will be reaching variety of data and graphs.
Thesis/ Hypothesis:
The probability of developing asthma is influenced by uncontrollable factors such as age, sex or having other respiratory diseases; however, living habits of patients as well as the environment around them are also important factors that affect the severity or the chance of having asthma.
Motivation:
The main reasons why we choose asthma as our topic is because asthma has been a common disease in our life. There are millions of asthma sufferers around the world and some of them are around us. We believe by exploring the risk factors and the ways that can cause asthma like: age and sex, personal habit and environment, we can know more about the disease and how to prevent it.
Background information
What causes asthma?
Asthma symptoms develop when the airways become inflamed as a result of exposure to specific environmental triggers, such as dust, smoke or even exercise. However, not all individuals exposed to the same triggers develop asthma symptoms. The main reason for this is that some individuals are genetically more like
Asthma becomes more and more common disease in the world. According to the Centers for Disease Control, 1 in 13 people have asthma. Also, there are no ways to heal asthma but there are only some ways that can calm it down.
Terminology
Asthma: a disease of the airways or branches of the lung (bronchial tubes) that carry air in and out of the lungs. Asthma causes the airways to narrow, the lining of the airways to swell and the cells that line the airways to produce more mucus. These changes make breathing difficult and cause a feeling of not getting enough air into the lungs. Common symptoms include cough, shortness of breath, wheezing, chest tightness, and excess mucus production.
Asthma rate/ asthma prevalence: the percentage or number of people that have asthma.
Allergy: an exaggerated response to a substance or condition produced by the release of histamine or histamine-like substances by affected cells.
Air pollution: The condition in which air is contaminated by foreign substances, or the substances themselves.
BMI: BMI stands for body mass index; it is used to indicate a person’s fatness. BMI is calculated using the person’s height and weight.
Chronic disease: a disease that can be controlled, but not cured.
Arguments
Argument #1: Age and sex (other allergies)
Age, sex are uncontrollable factors that will have an effect a person’s chance of suffering from asthma, while having other respiratory disease can even increase the patient’s chance of developing asthma.
Asthma is a chronic disease that a large part of the population suffers from it. Like many other diseases, the chance of developing Asthma differs according to the age group the person belongs to. On the other hand, the risk of having asthma for male and female are also different. These are due to the conditions of each person’s airway will change according to their age and sex. Moreover, because asthma develops from airway inflammation, any other disease that is related to the respiratory system will also greatly increase the risk of developing asthma.
Argument #2: PERSONAL habits (smoking, obesity)
Asthma can also be acquired non-genetically due to personal habits such as smoking or being overweight.
Some of the asthma patients developed it from the blood relatives, but the chance of developing asthma and the severity of the disease can be controlled by a person. For instance, smoking can do damage to the entire respiratory system and greatly reduce lung function. It can narrow the airway which will increase the risk of asthma. Also good personal habit, such as and lifestyle can keep you body in good shape and keep the airway unobstructed therefore avoiding asthma.
Argument #3: ENVIRONMENT
Living in a poor environment that has poor air quality or constantly exposed to allergen and dusts can also cause Asthma and even make it deteriorates.
Asthma is a long term disease of a person’s airway and lungs; therefore, although the direct cause of asthma is still not completely clear, breathing in dust such as wood dust or chemicals for a long period of time will affect the health of your respiratory system and then increase the chance of asthma developing.
Argument 1
Gender and age
Asthma is a disease that affects people from all age groups. However the chance of having asthma differs depending on which age group one is in.
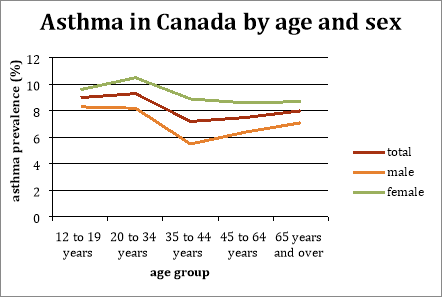
Figure 1.1.1 Graph of asthma prevalence and average humidity
From figure1.1.1 above we are able to see that asthma actually usually happens before 30 years old, which is mainly childhood and early adulthood. Adults in their middle age will be less vulnerable to asthma, then the percentage of asthma patient slightly increase as it reaches old age. Moreover based on the data from statistic Canada, there are more male asthma sufferers than female. The average difference between female and male are 2.16, which means male have 2.16% more chance of having asthma. It can be a huge difference while dealing with the population of the entire country.
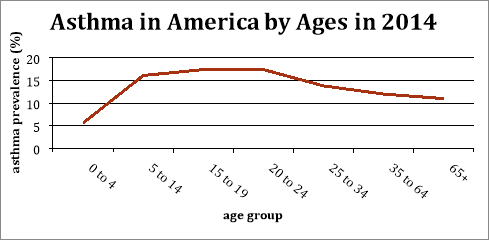
Figure 1.1.2
Figure 2 based on the data from CDC and it showed asthma prevalence of age group below 12 years old. In this graph we are able to see that although very little infant have asthma, 16 to 17% of the entire population around 5 to 24 years old suffers from asthma, that means there are 3 asthma patient in every 20 person. Similar with the data from statistic Canada, the graph showed that people in their early ages are more likely to be suffered from asthma. This might be due to the incomplete development of the lung and airway so the airway is more sensitive and vulnerable and easily infected so as during old age.
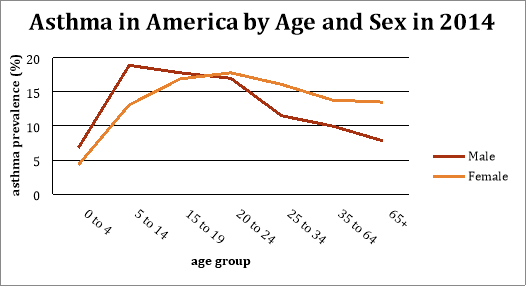
Figure 1.1.3
Figure1.1.3 above displayed the asthma prevalence of male and female. Among male, the asthma rate is more than 5% higher than female. It might be due to male’s respiratory system’s slower growth. While among female, the asthma rate is higher after puberty. This can be due to male’s airway become much stronger after puberty.
To conclude, although uncontrollable, gender and age is a risk factor that we should know in order to prepare for and preventing asthma.
Allergy and asthma
Another uncontrollable risk factor of asthma would be allergies and other respiratory disease.


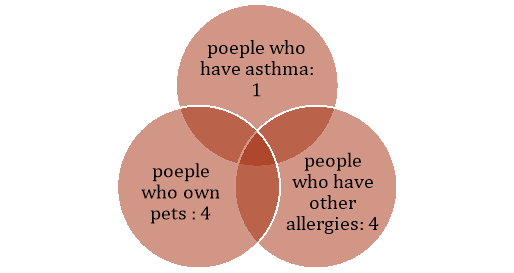
Figure 1.2.1
Figure 1.2.1 above used data collected from Unionville High School. In the sample, there are 4 people who suffer from asthma among 31 people which is near 13%. It matches the data from statistic Canada. Among these 4 people one of them own pet and two of them both own pets and have other allergies. Over half of the asthma patients have other allergies and the majority of them own pet. It shows owning pet might be a risk factor of asthma and the reason behind it might be the fur that can cause inflammation in the airway. Moreover there is a relationship between asthma and other type of allergies
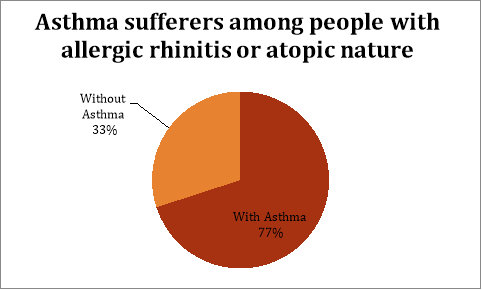
Figure 1.2.2
The result from another research also supported this argument. Most people that suffer from other allergies or atopic disease are also asthma sufferers therefore people with allergies are more likely to suffer from asthma.
Genetic and asthma
A very common way of having asthma is inheriting the disease from the family. This might be due to the genes they inherited from their parents have similar characteristic therefore asthma can be inherited.
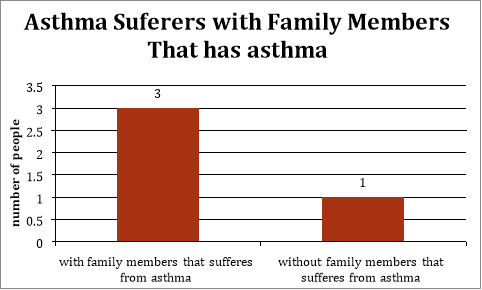
Figure 1.3.1
Looking at Figure 1.3.1 based on a sample from Unionville High School, 3 asthma sufferers out of 4 have family members that suffer from asthma. It is clear that the amount of asthma sufferers with siblings or parents that also have asthma is much higher than ones without. We can conclude that having a family member with asthma can raise the chance of developing asthma.
Argument 2
Other than those uncontrollable factors that are related to a person’s age, sex and other disease, ones everyday habit and activities is can also affect the asthma rate. Two of these unhealthy habits that can increase one’s chance of having asthma will be smoking, overeating or lack of exercising that can cause obesity.
Smoking and asthma
Asthma is a common respiratory disease in the world. There are few ways that will turn this disease bad, Smoking is one of the major bad habit that turn asthma bad. Smoking is the inhalation of the smoke of burning tobacco encased in cigarettes, pipes, and cigars. According to the CDC, a research demonstrated that there is a higher rate to have asthma if you smoke. There are about 17% people in the US that smoke but there are about 21% people who smoke with asthma.
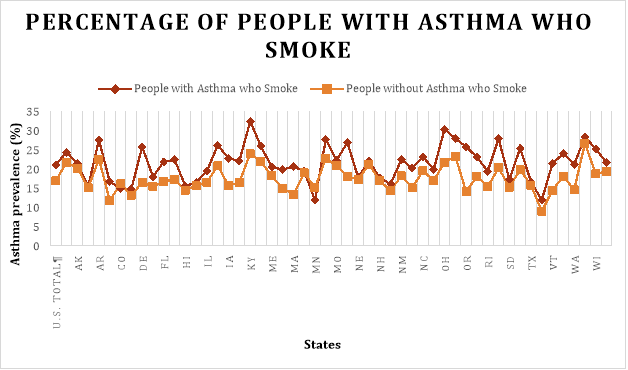
Figure 2.1.1
The graph above demonstrated the people in different province in the United States and is split by with asthma who smokes and without asthma who smoke. The result shows that there are more people that smoke with asthma than without asthma.
Overweight and asthma
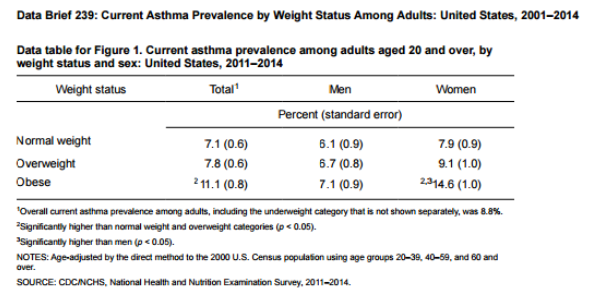
Although Asthma is a respiratory disease, one’s body mass index (BMI) is also a factor of developing asthma and even an asthma attack. BMI is calculated using one’s height and weight; when a person’s body mass index (BMI) is between 18.5 and 25, he will be considered normal, however when the person’s BMI is between 25 to 30 he will be considered overweight and obese if the BMI is over 30. Graph 2.2.1 below shows the percentage of normal weight, overweight and obese adults suffering from asthma.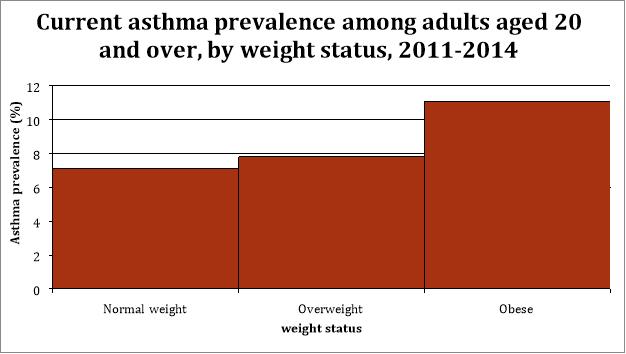
Figure 2.2.1
The graph shows the relationship between one’s BMI and asthma. For both men and women, the chance of suffering from asthma for an obese person is significantly higher than a normal weighted person. For the obese group, the asthma prevalence is almost 50% higher than the normal weight group. We can easily see that being overweight can greatly influence the prevalence of asthma, overweight people are more likely to suffer from asthma compared with others. This is because the extra weight on an overweight person will increase the pressure on his chest therefore it will be harder for the person to breath. On the other hand, inflammation, which obesity usually comes with, also contributes to increasing the risks of developing asthma. Inflammation around the wall of the airway will make it swollen and decrease the width of the airway, allowing lesser air to pass, and cause multiple asthma symptoms such as wheezing, coughing, and breathing difficulties. From the data, we are able to conclude the theory is true and being obese will greatly increase one’s chance of developing asthma.
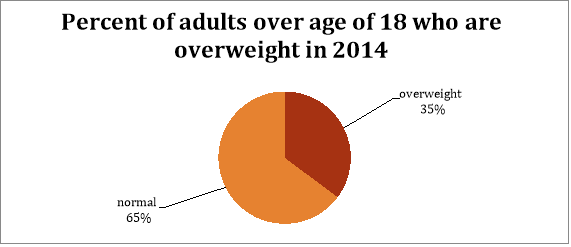
Figure 2.2.2
https://nccd.cdc.gov/NPAO_DTM/IndicatorSummary.aspx?category=28&indicator=30
From graph 2.2.3, we are able to see that according to CDC, more than 10% of the America’s population is obese, that means they will all be having a much higher risk of having asthma than the rest and they should be more careful about while doing strenuous exercise.
Argument 3
While one’s persona condition and habit changes his chance of developing asthma, like many other disease, the environment around the person can also influence the incidence of the disease. This is due to the environment can affect one’s health condition slowly therefore a good environment can decrease one’s chance of suffering from diseases and vice versa.
Poverty and asthma
One of the factors that can affect one’s living environment is one’s income. Typically, family that have more money will be able to afford living in cleaner area, more comfortable space and overall, a better environment; while the families with less income will not. Dust, small particles, molds, insects and many more types of allergens in these environment can trigger asthma and exposed to them will absolutely be a factor that causes asthma.
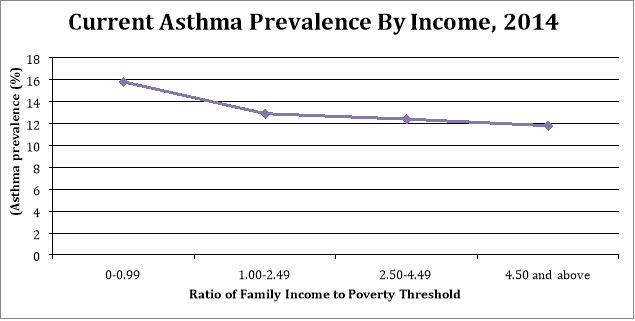
Figure 3.1.2 Graph asthma prevalence by income in 2014
https://www.cdc.gov/asthma/nhis/2014/table2-1.htm
The graph above shows the percent of people suffering from asthma versus their poverty level in America. Federal poverty threshold in the graph is a measure of income for every person. The standard income for an American is calculated each year and it is shown in the table below.
|
PERSONS IN FAMILY/HOUSEHOLD |
POVERTY GUIDELINE |
|
1 |
$11,670 |
|
2 |
15,730 |
|
3 |
19,790 |
|
4 |
23,850 |
|
5 |
27,910 |
|
6 |
31,970 |
|
7 |
36,030 |
|
8 |
40,090 |
|
For families/households with more than 8 persons, add $4,060 for each additional person. |
|
From graph 1 it is clear that there is a trend that shows less people suffer from asthma as their income increase. For instance for people with income lower than the poverty guideline, the prevalence of asthma reached up to 10%.
Moreover, the area one lives in also matters
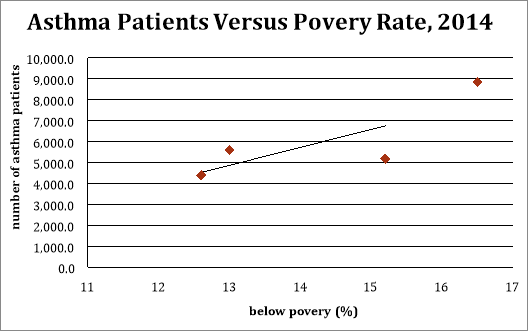
Figure 3.1.3 Graph of amount of asthma patient versus poverty rate in 2014
http://www2.census.gov/programs-surveys/cps/tables/time-series/historical-poverty-people/hstpov9.xls
Figure 3.1.3 above showed the poverty rate and asthma rate of the four regions in the United States. It also indicated that as the poverty rate of a certain region or area gets higher, so does the asthma rate. In general, families living in poverty lives in less developed areas, which means that they might know less about how to deal with asthma and asthma prevention. These data prove the relationship between poverty and asthma; therefore family that have less income is likely to have a higher risk of having asthma.
Air pollution and asthma
As mentioned, asthma is a type of long term respiratory disease and it mainly affects the airway and trachea, which is a part of the respiratory system. It is used as a tube to transfer air in and out of the lung while breathing; so, during this process, the wall of the airway frequently makes contact with the air outside that contains many pollutants. Therefore unlike skin that covers the human body, the unprotected wall can get infected and be stimulated very easily. Then the inflamed airway will cause coughing, wheezing and even asthma. Therefore if the environment isn’t clean and the air quality isn’t good, the chance of developing asthma increases.
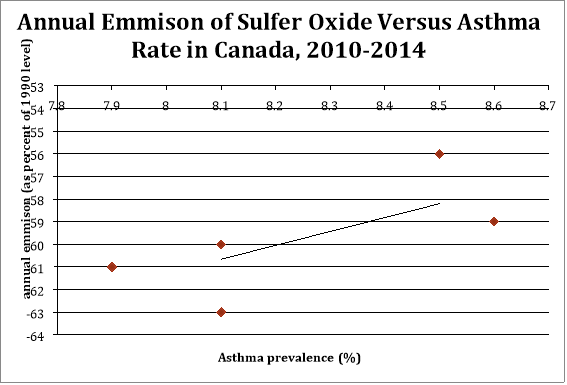
Figure 3.2.1 Graph of emission of sulfur oxide and asthma rate from 2010 to 2014
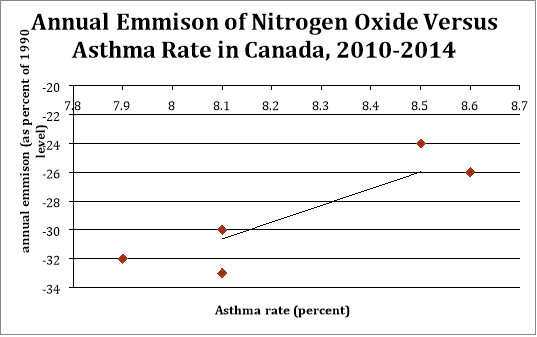
Figure 3.2.2 Graph of emission of nitrogen oxide and asthma rate from 2010 to 2014
http://www.ec.gc.ca/indicateurs-indicators/default.asp?lang=en&n=E79F4C12-1
The two graphs above show the relationship between the emissions of several types of air pollutants as percentage of 1990 level and the percentage of people with asthma in canada from 2010 to 2014. We are able to see that there is a trend, as the emission of the two air pollutants decreases the percentage of people with asthma also decrease. For example, sulfur dioxide, a form of sulfur oxide found in lower atmosphere, is a harmful toxic chemical. The r of the trend line is about 0.703, which means there is a strong relationship between the emission the chemical and prevalence of asthma. In fact according to CDC, exposure to this type of chemical will affect one’s lung health. Asthma suffers is more sensitive to even low concentration of sulfur dioxide. On the other hand, there is also correlation between emission of nitrogen oxide and asthma prevalence. The r in graph 3.2.2 is 0.9 therefore it shows that the relationship with asthma prevalence is even stronger for nitrogen oxide. A research done by WHO indicates that respiratory disease is more common in area with higher nitrogen oxide concentration. Therefore, inhaling either of these chemicals in the air can do damage on one’s respiratory system can is one of the factors of asthma.
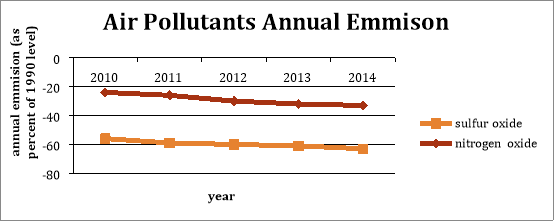
Figure 3.2.3
http://www.ec.gc.ca/indicateurs-indicators/default.asp?lang=en&n=E79F4C12-1
Luckily, from the graph above, we can see that the emissions of these toxic chemicals are decreasing. Thus we can expect that as the average air quality get better in the future and the concentration of these chemicals decrease, the percentage of people with asthma should also slowly decrease.
Climate and asthma
Last but not least, the climate of each region also has an effect on the chance of developing asthma. In fact, one of the factors that can affect one’s respiratory system would be humidity. Humidity is the amount of water in the air and higher humidity would mean there are more water around the atmosphere. When the humidity gets higher, it will be more difficult to breath in this kind of atmosphere, but if the atmosphere is too dry, the airway will be inflamed due to lack of water and will also be a factored that triggers asthma.
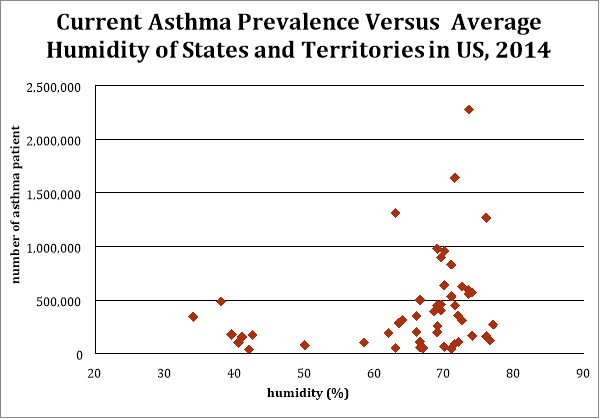
Figure 3.3.1 Graph of asthma prevalence and average humidity
https://www.cdc.gov/asthma/most_recent_data_states.htm
https://www.currentresults.com/Weather/US/humidity-by-state-in-summer.php
From this graph, we are able to see a “U” shaped trend. Most states in the United States have similar average humidity and asthma rate. However as the average humidity increase, more people suffer from asthma; as the average humidity decrease lower than 40% the amount of asthma patient increases again. As a matter of fact, the world health organization claimed that 50% humidity will be best to reduce the chance of developing asthma or asthma attack. State such as New Jersey and Maryland, are located at the east coast, had higher average humidity, being around 70% has more asthma patient; while states near the west coast has a lower average humidity around 60% and has less people has asthma there. On the other hand, the states in the middle region have a low average humidity near 30% to 40%; as expected the amount of asthma patients goes up. Therefore the theory a stated above is proven to be true, humidity can affect one’s chance of developing asthma or an asthma attack.
Conclusion
Limitations
Bias
There is sampling bias in the result of our survey; this is because we take our sample from Unionville High School. The population in the school is mainly Asian therefore although we narrowed our report to only about North America; it can’t represent the situation in North America precisely. Moreover, we used snowball sampling while sending out the survey, the amount of Asians and non-Asians in the result will be more unbalanced.
Not enough information
When we are doing our research we found out that there are not many raw data that we can use, many of them are directly made into graphs or figures without posting the raw data and some of the data isn’t able to be found on the internet. Moreover there are countries that do not make their data public. Therefore we decided to narrow our range down to only North America. And we found out that Statistic Canada and CDC have a lot of open source that we can work with
Works Cited
https://aspe.hhs.gov/2014-poverty-guidelines#tresholds
Appendix
Table 1
|
Asthma, by age group and sex (Percent) |
|||||
|
2010 |
2011 |
2012 |
2013 |
2014 |
|
|
percent |
|||||
|
Total, 12 years and over |
8.5 |
8.6 |
8.1 |
7.9 |
8.1 |
|
Males |
7.1 |
7.4 |
6.8 |
6.9 |
7 |
|
Females |
9.8 |
9.8 |
9.4 |
8.9 |
9.2 |
|
12 to 19 years |
11.1 |
11.8 |
10.2 |
10.9 |
9 |
|
Males |
11.4 |
11.1 |
10.6 |
11.1 |
8.3 |
|
Females |
10.8 |
12.5 |
9.8 |
10.7 |
9.6 |
|
20 to 34 years |
9.5 |
9.1 |
9.7 |
8 |
9.3 |
|
Males |
8.5 |
7.9 |
8.7 |
7.4 |
8.2 |
|
Females |
10.5 |
10.4 |
10.7 |
8.6 |
10.5 |
|
35 to 44 years |
7.7 |
8 |
6.8 |
8 |
7.2 |
|
Males |
6.3 |
7.2 |
5.7 |
7.3 |
5.5 |
|
Females |
9.1 |
8.7 |
8 |
8.7 |
8.9 |
|
45 to 64 years |
7.9 |
8.1 |
7.1 |
7.1 |
7.5 |
|
Males |
5.5 |
6.6 |
4.7 |
5.6 |
6.4 |
|
Females |
10.4 |
9.6 |
9.4 |
8.6 |
8.6 |
|
65 years and over |
7 |
7.3 |
7.7 |
7.5 |
8 |
|
Males |
6.2 |
5.6 |
6.4 |
5.8 |
7.1 |
|
Females |
7.6 |
8.7 |
8.8 |
9 |
8.7 |
http://www.statcan.gc.ca/tables-tableaux/sum-som/l01/cst01/health49b-eng.htm
Table 2
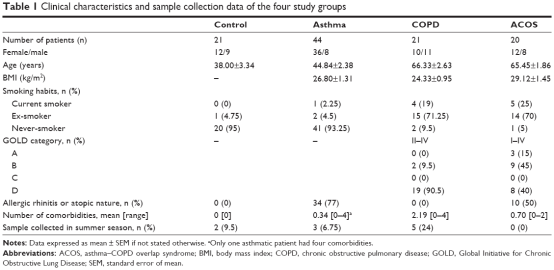
https://www.dovepress.com/cr_data/article_fulltext/s91000/91654/img/COPD-91654-T01.png
Table 3

https://www.cdc.gov/asthma/nhis/2014/table2-1.htm
Table 4
https://www.cdc.gov/nchs/data/databriefs/db239_table.pdf#1
Table 5
2014: Percent of adults aged 18 years and older who are overweight
|
Location |
Value |
95% CI |
Sample Size |
|
National |
35.2 |
(34.9-35.5) |
425,875 |
https://nccd.cdc.gov/NPAO_DTM/IndicatorSummary.aspx?category=28&indicator=30
Table 6
|
Ratio of Family Income to Poverty Threshold |
All Ages Total |
Children <18 |
Adults 18+ |
|
0-0.99 |
15.8 |
15.6 |
15.9 |
|
1.00-2.49 |
12.9 |
13.2 |
12.9 |
|
2.50-4.49 |
12.4 |
12.8 |
12.3 |
|
4.50 and above |
11.8 |
12.3 |
11.7 |
https://www.cdc.gov/asthma/nhis/2014/table2-1.htm
|
Region: |
All ages Total |
Children Age <18 |
Adults Age 18+ |
|
Northeast |
7,060 |
1,751 |
5,309 |
|
Midwest |
9,202 |
2,073 |
7,129 |
|
South |
14,965 |
3,900 |
11,065 |
|
West |
9,234 |
2,139 |
7,095 |
https://www.cdc.gov/asthma/nhis/2014/table1-1.htm
|
Year |
Total |
Northeast |
||||
|
Total |
Below poverty |
Total |
Below poverty |
|||
|
Number |
Percent |
Number |
Percent |
|||
|
2015 |
318,454 |
43,123 |
14 |
55,779 |
6,891 |
12 |
|
Year |
Midwest |
South |
||||
|
Total |
Below poverty |
Total |
Below poverty |
|||
|
Number |
Percent |
Number |
Percent |
|||
|
2015 |
67,030 |
7,849 |
11.7 |
119,955 |
18,305 |
15.3 |
|
Year |
West |
||
|
Total |
Below poverty |
||
|
Number |
Percent |
||
|
2015 |
75,690 |
10,079 |
13.3 |
http://www2.census.gov/programs-surveys/cps/tables/time-series/historical-poverty-people/hstpov9.xls