SSE’s acquisition of The Energy Solutions Group (ESG)
EXECUTIVE SUMMARY
This report has been undertaken to come up with the intrinsic value of SSE plc which is operating in energy industry, using shareholder value analysis (SVA) model. The underlying value of the company is estimated to be £12,122.14m, which is lower than the market value of £15757.52m (FAME database, accessed on 19th January 2017). The discrepancy of the two values may be explained by referencing to Efficient Market Hypothesis, asymmetric information issue and shortcomings of SVA model.
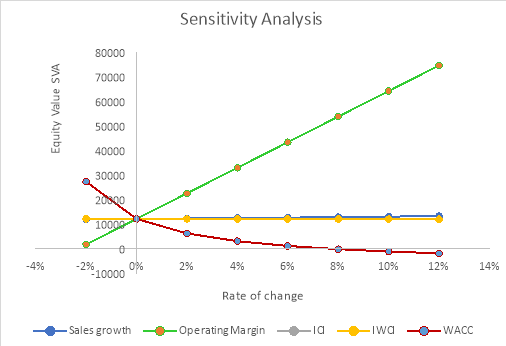
Based on sensitivity analysis, it is determined that SSE’s intrinsic value is highly sensitive to changes in operating margin and WACC. It is found out that an adjustment of +2% made towards operating margin and WACC will remarkably change the company value by +86% and nearly -50% respectively. Therefore, analysts should pay more attention to these two variables when employing SVA model.
The later section of the report identifies SSE’s acquisition of The Energy Solutions Group (ESG) as a critical financial event, highlighting that the transaction will bring more synergy to the firm’s operation and enhance its competitive advantage in the energy industry. However, it is imperative for shareholders to keep track of the company’s performance to alleviate problems of hubris or empire building.
This financial report is expected to achieve two primary objectives. First, this report aims to provide the valuation and analysis of SSE plc – a company operating in the energy industry by employing Shareholder Value Analysis (SVA) technique. Second, SSE’s acquisition of The Energy Solutions Group (ESG) in 2014 will be evaluated with reference to finance theories in Mergers and Acquisitions.
This financial report is organized in five main parts:
- Section I: Introduction
This section provides main purposes of the report and briefly describe structure of the report.
- Section II: Company Profile
This section gives an overview of SSE’s business activities, its market share and competitive positioning.
- Section III: Company Valuation
This section covers the following contents:
- Evaluate the appropriateness of SVA model to value a company
- Perform the valuation of SSE plc using SVA model
- Provide justifications for variables and proxies used in the model
- Carry out comparative analysis and sensitivity analysis
- Section IV: Actual Corporate Financial Event
This section critically evaluates SSE’s acquisition of The Energy Solutions Group (ESG) with reference to finance theories. Some implications would also be proposed following the event evaluation.
- Section V: Conclusion
This section summarizes the employment of SVA measure in case of SSE and then provide some recommendations.
SSE plc (Scottish and Southern Energy plc) is a British energy company headquartered in Perth, Scotland, United Kingdom. SSE was established in 1998 as a result of the merger between Scottish Hydro-Electric and Southern Electric. SSE is listed on London Stock Exchange and it stock forms part of FTSE 100, FTSE 350 and FTSE All-Share.
SSE’s business covers three segments: Wholesale, Networks and Retail. The Wholesale segment involves power generation from renewable and thermal plant in the United Kingdom, Ireland and Europe; the Networks segment is responsible for distributing electricity to customer premises in the North of Scotland and the South of England; meanwhile, the Retail segment supplies electricity and gas to residential and business customers in the United Kingdom and Ireland (Financial Times, 2017). Since SSE undertakes both generation and retail supply activities, it is considered a vertically integrated energy business. This makes SSE unique since SSE is the only company listed on London Stock Exchange involved in such a broad range of energy businesses (SSE, 2016a).
Regarding Wholesale business, in 2015 SSE had a small market share of 7%, accounting for only a quarter of EDF’s share and about half of RWE’s share (see Appendix 1). Referring to Ofgem (2016b), in 2015 the market shares of dominant energy producers in the UK remain relatively unchanged compared with these of 2014, which is also the case of SSE.
With respect to Retail business, there were over 43 active energy suppliers in Britain by March 2016, most of which offering both gas and electricity supply (Ofgem, 2016a). SSE is included in “Big 6” which are widely known as dominant leaders in the market, including British Gas, EDF Energy, E.ON, SSE, npower and ScottishPower. These companies supply gas and electricity to over 50 million household and businesses in Britain, with 87% share of domestic customers by March 2015 (Ofgem, 2016a).
SSE is operating in a very competitive and well-functioning energy retail market. The firm’s market share in the market for energy supply can be illustrated in Appendix 2 and Appendix 3. By March 2016, SSE had the second largest market share of UK electricity supply market (about 15%), while its market share of gas supply (about 13%) only accounted for approximately one-third of British Gas’s share.
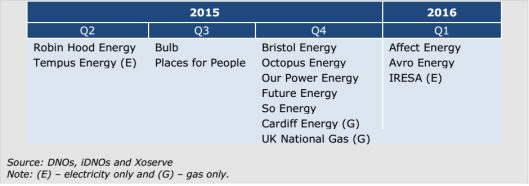
Out of the three segments, Wholesale and Retail businesses have been facing increasing competition in recent years due to the entrance of new rivals in the GB Energy Supply market. There have been some concerns over barriers to entering wholesale and retail energy market such as the complexity and extent of credit requirements or low levels of liquidity in the market. Despite of these, new entry has taken place (see Appendix 4).
The result of new suppliers’ entry is falling market share of the six large suppliers – from 90% to 87% between March 2015 and March 2016 for electricity, and 90% to 86% for gas over the same period (Ofgem, 2016a). Specifically, the entry and growth of new suppliers has led to SSE’s market share declining. There is a decreasing trend in the number of energy customer accounts for the past three years (see Appendix 5).
In addition to the new rivalries’ entrance to the market, customer’s switching is another issue that reduce the market share of six large suppliers. Households are increasingly turning to smaller suppliers, with consumers complaining the sector is slow to pass on wholesale energy cuts and offers poor service. The total number of users switching suppliers in March 2016, 476,528 customers, was the highest since November 2013 (Energy UK, 2016).
As the market become more and more competitive, attracting and retaining customers can pose challenges to SSE. However, SSE has a clear strategy to differentiate itself and create value by becoming a market-leading, digital and diversified retailer of energy and essential services. According to SSE (2015a), for the past few years SSE has:
- Launched its first large-scale advertising campaign for the SSE brand in both Britain and Ireland, known as ‘Proud to make a difference’ campaign. The campaign has been implemented in many forms from TV, radio, billboards, print media to various digital and social media formats;
- Overhauled its digital channels in order to create a simple, seamless and intuitive customer experience and provide the best possible service at the lowest possible cost;
- Introduced a new customer relationship management (CRM) platform which facilitates better customer understanding and tailors communications and propositions to the needs of different customers;
- Developed and reopened sales channels and processes to ensure compliant growth.
Additionally, SSE’s commitment to decarbonization means that the firm will continue potential expansion in renewable energy portfolio which are comprised of onshore wind, offshore wind and conventional hydro. Furthermore, SSE is the leader in the UK energy industry to handle customer complaints. According to Energy Ombudsman in February 2016, only four out of 100,000 customer complaints required further investigation in the first three quarters of the year, pointing out the fact that 99.969% of SSE’s customer issues were fully resolved (SSE, 2016a).
3.1 Evaluate the appropriateness of SVA Model
There are many methods for estimating value of a company, including valuations based on asset, dividend, earnings and cash flows. Among these methods, discounted cash flow valuation is the most technical way of valuing a business as it is heavily dependent on assumptions about long-term business conditions. This measure is especially useful for cash-generating businesses which are stable and mature. Alfred Rappaport (1998) developed a simplified approach of cash flow discounting called shareholder value analysis (SVA). SVA model makes assumptions about steady changes in a number of cash flow factors as they are all relevant to sales level.
There are obvious advantages associated with the use of this model. SVA is not subject to different accounting policies used by different companies and therefore can be applied across many business sectors. In addition, firms using SVA must concentrate on the future and customers, with specific focus on future cash flows. On the other hand, SVA is not a perfect model as it contains some shortcomings when being used in practice. Irrational assumptions about value drivers, as well as data unavailability are possible drawbacks that analyst frequently encounter when employing this model.
3.2 Justification of variables and proxies
Employing the SVA Model to calculate a company’s intrinsic value requires assumptions about a number of key variables. Sales growth might be the most important factor in the model, setting the foundation to come up with other variables’ values such as operating profit, incremental capital investment and incremental working capital investment. In case of SSE, sales growth is determined after careful consideration of historical growth rates, price forecast and potential future projects. For the last three years, sales growth has witnessed a decreasing trend, which can be explained by a number of reasons.
First, energy prices in the UK are influenced by oil and coal prices; therefore, when these commodities’ prices move upward or downward, they are likely to drive gas and electricity prices in the same direction (Ofgem, 2016b). Since the second half of 2014, there were downward trends in oil and coal prices due to oversupplied markets for these commodities, contributing to declining energy prices and therefore SSE’s revenues. The movements of oil price can be illustrated in the following figure:
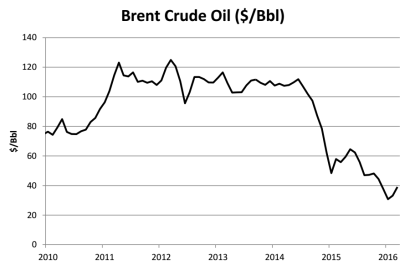
Figure 1: Brent Crude Oil price from 2010 to 2016
(Source: Bloomberg, 2016)
Second, there are more and more energy suppliers in the UK market. Levels of new entry have been very high recently: 14 new suppliers became active between April 2015 and March 2016, compared to five between April 2014 and March 2015 (Ofgem, 2016a). The presence of new rivals leads to SSE’s declining market share as well as the firm’s revenue.
Third, more and more customers are switching to small and medium-sized suppliers, as shown in Figure 2. If this trend goes on, there will be much pressure on expected revenue of large energy suppliers.
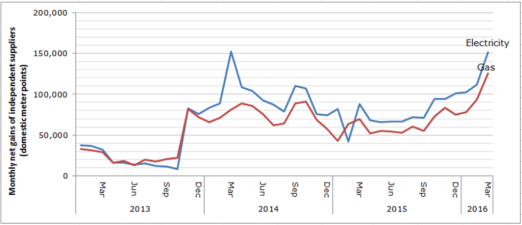
Figure 2: Monthly increases in the total number of domestic gas and electricity meters supplied by small and medium-sized suppliers
(Source: Ofgem analysis of data provided by Xoserve, DNOs and iDNOs, 2016)
From the above data, it might seem that SSE’s revenue will be struggling in the next few years. However, there are evidences for investors to believe in SSE’s sales growth for at least the next 5 years. First, oil price forecasts by World Bank, IMF and EIU indicate crude oil prices will observe steady increases from 2017 to 2025 (Knoema, 2016) (see figure 4, figure 4 and figure 6).
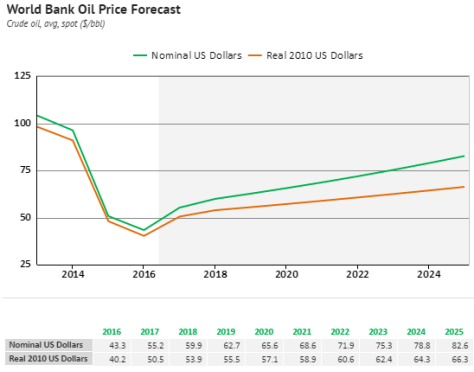
Figure 3: World Bank Oil Price Forecast
(Source: Knoema, 2016)
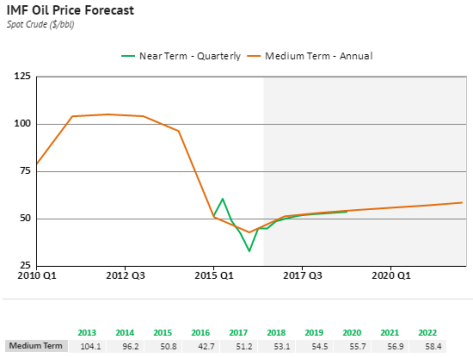
Figure 4: IMF Oil Price Forecast
(Source: Knoema, 2016)
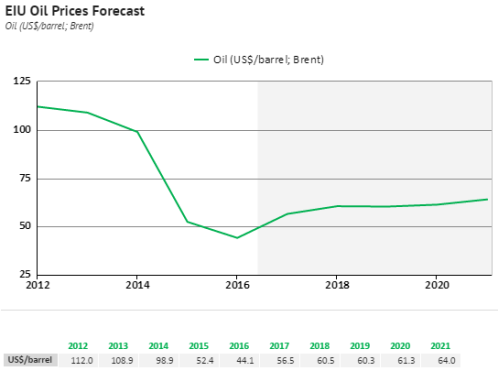
Figure 5: EIU Oil Price Forecast
(Source: Knoema, 2016)
Second, some renewable projects will be fully operational in 2017 and these will definitely support revenue growth in the next few years. As reported by SSE (2016c), three onshore wind projects under construction are expected to come into operation in 2017, including Dunmaglass (94MW), Clyde Extension (173MW) and Bhlaraidh (108MW).
After above analysis has been taken into account, the sales growth is determined as the arithmetic average of the changes in sales over the previous three years, giving the result of 0.82%. This sales growth is reasonable given that SSE is operating in increasingly competitive industry, with customers tending to switch to small and medium-sized suppliers in recent years.
The operating profit margin is predicted to be 2.87%, which can be worked out by taking the average of the margins in previous three years. The reason behind this assumption is that SSE is an efficient energy supplier committed to maintaining relatively low operating costs in order to make a fair profit. According to SSE (2015a), SSE’s indirect costs per customer are around 20% lower than the average across the rest of the major suppliers. The effect of low operating costs can be demonstrated by stable operating profit margins for the last three years, and it is expected that this trend will continue for the coming financial years.
The incremental capital investment of 53% is understandable as the company continues to develop secure, sustainable and low carbon energy infrastructure, given that the energy industry is switching to renewable energy sources. In its interim results for the six months to 30 September 2016, SSE announced it plans to invest a record £1.85bn of capital expenditure and investment in Great Britain and Ireland in 2016/17 (SSE, 2016b). According to Alistair Phillips-Davies, SSE Chief Executive, the firm is making more investment in supporting the modernization of UK’s energy facilities, and the total investment and capital expenditure by 2020 is forecast to reach approximately £6bn.
A relatively low working capital investment of 10% is determined since SSE’s current assets are just enough to absorb current liabilities in the last few years. Trade and other receivables accounts for a large proportion of SSE’s current assets due to the nature of the energy supply business. Meanwhile, current liabilities are mainly comprised of trade and other payables, which is because the company is making heavy investment in renewable energy infrastructure. Simply put, an incremental working capital investment of 10% is appropriate for SSE given that many potential energy projects will be under construction in the coming years.
The corporation tax rate of 20% is applied to company profits (HMRC, 2016), and SSE’s business is also subject to this rate.
Another key variable in SVA is weighted average cost of capital (WACC). The cost of debt is determined as SSE’s weighted average interest rate, which is 3.73% for year 2016. Meanwhile, the cost of equity is computed using CAPM model. SSE’s beta (0.74) was obtained from FAME database, while the UK Gilt 10 Year Yield (1.40%) collected on Bloomberg website is used as the proxy for risk-free rate; all of these figures were retrieved on 19th January 2017. In addition, the UK market risk premium (5.3%) by Fernandez, et al., (2016) is another key component in the CAPM. Subsequently, a WACC of 4.59% is achieved and this is the required rate of return for SSE’s capital providers.
In short, the following seven value drivers will be applied in case of SSE:
Table 1: Seven value drivers for SVA model
|
Key Drivers |
Value |
|
Sales growth |
0.82% |
|
Operating Profit margin |
2.87% |
|
Tax rate |
20% |
|
Incremental fixed capital investment |
53% |
|
Incremental working capital investment |
10% |
|
Planning Horizon |
5 |
|
Required Rate of Return |
4.59% |
Source: Analyst’s estimate
Table 2 illustrates how SVA model is utilized in SSE’s case. SSE’s revenue of £28,781m (recorded on 31st March 2016) was increased annually by a sales growth of 0.82% over a 5-year planning horizon. Subsequently, an operating margin of 2.87% was applied to revenues to come up with the firm’s operating profit. Before arriving at SSE’s operating cash flows, a corporation tax rate of 20% was imposed on the operating profit, followed by subtractions of 53% in incremental capital investment and 10% in working capital investment. Afterwards, the present value of future cash flows was estimated by discounting the firm’s operating cash flows by 4.59% cost of capital. It is noted that SSE’s terminal value at year 6+ was discounted twice, the first of which worked out the value at year 5 and the second one brought out the value in present day. After the net present value of £18,930.7m was figured out, adjustments were made by adding £360.2m cash and marketable securities, and then deducting £7,168.8m total debt. After all, SSE’s intrinsic value was determined at £12,122.14m.
Table 2: SSE’s Shareholder value analysis (unit: million pounds)
|
Year |
1 |
2 |
3 |
4 |
5 |
6+ |
|
Sales |
29,018.4 |
29,257.7 |
29,498.9 |
29,742.2 |
29,987.5 |
29,987.5 |
|
Profit |
833.6 |
840.5 |
847.4 |
854.4 |
861.5 |
861.5 |
|
Associate Profit |
206.5 |
208.2 |
209.9 |
211.6 |
213.4 |
213.4 |
|
Less Tax |
166.7 |
168.1 |
169.5 |
170.9 |
172.3 |
172.3 |
|
Less ICI |
125.1 |
126.1 |
127.2 |
128.2 |
129.3 |
0 |
|
Less IWCI |
23.7 |
23.9 |
24.1 |
24.3 |
24.5 |
0 |
|
Operating Cash Flow |
724.6 |
730.6 |
736.6 |
742.7 |
748.8 |
902.6 |
|
PV of cash flows |
692.8 |
667.8 |
643.8 |
620.6 |
598.3 |
15,707.4 |
|
NPV |
18,930.7 |
|||||
|
Add mkt secs |
19,290.9 |
|||||
|
Less debt |
7,168.8 |
|||||
|
Equity Value SVA |
12,122.14 |
million |
||||
|
Actual Value |
15,757.52 |
million |
FAME access on 19th January 2017 |
|||
Source: Analyst’s estimate
SSE’s intrinsic value derived from SVA model was £12,122.14m while its market capitalisation was recorded at £15757.52m (FAME database, accessed on 19th January 2017), pointing the difference of £3,635.38m between the two values.
One possible explanation for this discrepancy is that all relevant information may not be incorporated into the share price. It could be inferred from Efficient Market Hypothesis (Fama, 1970) that the extent to which the share price is reliable depends on the efficiency of the markets. Under the strong form efficiency, the market value of £15757.52m will fully reflect all past, present and insider information. On the other hand, if the market is under the weak form efficiency, the market value of £15757.52m will only reflect the historical prices of the security, and hence lacking reliability. Furthermore, the information asymmetry, e.g. between management and investors and between investors themselves, is another explaining factor. Plesco & Sobol (2013) states that investors who are ill-informed about financial disclosures can make unreasonable decisions in their investment. Due to irrational trading behaviours of these investors, share prices may not yield a fair market value.
Another cause of the difference between the two values lies in the limitations of SVA model. The constant sales growth every year is not very realistic because the growth depends on potential development and firms’ strategies, which are subject to annual reviews. In the same manner, keeping WACC (4.59%) constant over 5-year planning horizon is not rational in practice, because the firm’s capital structure will change over time. Last but not least, the assumptions of sales growth and other key variables depend on each analyst’s subjective viewpoint. Changing these values by a small percentage might result in considerable change in eventual intrinsic value.
The sensitivity analysis performance indicates that SSE’s underlying value is highly sensitive to changes operating profit margin. A positive adjustment of 2% made towards the operating margin will result in a substantial increase of 86% in the firm’s equity value (see Appendix 6). It is worth remembering that SSE is committed to preserve low operating costs so as to gain a fair profit. According to SSE (2015b), the firm has participated in a value program to ensure effective use of people and capital, the overall objective of which is business’ streamlining and simplification. This program comes with efficiency target, with expected £100m of annual savings in overheads. In addition, the program involves reduction in offshore wind development as well as disposal of non-core assets. In general, this value scheme is likely to help SSE optimize its investment and re-balance its business.
Moreover, it is noticeable that the firm’s intrinsic value is susceptible to changes in WACC. An adjustment of +2% in the WACC will lead to approximately 50% reduction in the firm’s equity value (see Appendix 6). According to Fitch Ratings (2016), SSE’s equity has been diminishing recently due to the influence of sustained asset impairment losses and generous dividend pay-outs. In agreement with Pecking Order Theory, debt takes priority over equity in case external finance is required (Donaldson, 1961). Because SSE’s cost of debt (3.73%) is lower than cost of equity (5.32%), it is appropriate for SSE to obtain more bank loans to finance its long-term operations, while still making sure cost of capital is kept to a minimum. Particularly Fitch Ratings (2016) claims that SSE has a policy of accessing debt markets, ensuring that its committed borrowings equal to at least 105% of forecast borrowings over a six-monthly rolling period and adequate liquidity will be fulfilled until at least September 2017.
In the end of July 2014, SSE completed the acquisition of The Energy Solutions Group Topco Limited (ESG), the North west-based provider of energy management services, from Bridgepoint Development Capital for £66m with an additional £6m if agreed targets are achieved. Working with private and public sector customers, ESG identify improvements in their management of energy consumption; as well as install, maintain and support building management systems and solutions, saving customers around 20% to 30% of their energy consumption (SSE, 2014).
4.2 Evaluation of the issue in the context of finance theories
This acquisition is classified into vertical M&A (Mergers and Acquisitions). According to Arnold (2013), vertical M&A occur between companies operating in the same industry at different stages of production, i.e. one company acquires another company that is either before or after it in the supply chain process. In case of SSE’s acquisition, both SSE and ESG work in the energy industry. SSE involves in all many stages of energy supply chain including wholesale, networks (distribution) and retail; meanwhile ESG engages in the retail business where it is the designer and provider of energy management solutions. Therefore, SSE’s acquiring ESG would be a downstream vertical acquisition.
So, what is SSE’s motivation behind this acquisition? Vertical integration has some advantages, including the attraction of increased certainty of supply or market outlet; reducing cost of search, contracting, payment collection, advertising, communication and co-ordination of production (Arnold, 2013). SSE (2014) states that the acquisition of ESG will strengthen SSE’s services in competitive markets for industrial and commercial customers. These services are comprised of electrical and mechanical contracting, lighting services, private energy networks and telecoms, all of which are under the control of Enterprise division which forms part of SSE’s retail business. According to Arnold (2013), one of the merger and acquisition motives is synergy in which the two firms together are worth more than the value of the firms apart; hence in this case, ESG will bring commercial synergies to SSE’s Enterprise division.
SSE’s Chief Executive Alistair emphasized that managing energy costs and environmental impact are SSE’s big priority for large industrial and commercial customers. Benefiting from ESG’s expertise, SSE expects to meet the energy and related demands of these customers in an enhanced manner. It was confirmed that the ESG’s existing management team would be in charge of the Enterprise division, and the firm believed that the commitment of the ESG management team and other employees will benefit its customers and the environment in terms of effective energy management solutions delivery.
SSE’s acquisition of ESG is considered a strategic acquisition in order to achieve external growth. There are two ways to categorize strategic acquisitions: by type of capability transferred and by their relation to corporate strategy (Goold & Luchs, 1995). Regarding capability transfer, SSE (2015a) asserts that the acquisition of ESG added new capabilities to the business. (Goold & Luchs, 1995) claims that value is created in an acquisition when competitive advantage of one firm is enhanced through the transfer of strategic capabilities including resource sharing, functional skill transfer and management skill transfer. The presence of ESG management team in SSE’s Enterprise division will upgrade SSE’s capability of strategic planning, ensuring that effective energy management solutions are delivered for the sake of customers. Generally, SSE is expected to benefit from management skill transferred from ESG.
Another way to categorize strategic acquisitions is based on their contribution to corporate-level strategy. In other words, acquisitions are assessed considering their connections in maintaining and changing the balance between the firm’s existing domain and the renewal of its capabilities (Goold & Luchs, 1995). An acquisition’s contributions are classified into either domain strengthening, domain extension or domain exploration. In light of SSE’s acquiring ESG, this would be an illustration of domain strengthening because this acquisition will deepen SSE’s presence in retail business, especially reinforcing Enterprise division’s operation.
Next, it is essential to see what happened with SSE stock price after the firm made announcement about the acquisition of ESG. Theoretically, when a firm acquires another one, a short-term impact on the stock price of both companies is expected. Specifically, a lot of practical studies point out that the acquiring firm’s stock price will go down while the acquired entity’s stock price will rise (Investopedia, 2016a). With respect to the takeover company, its stock will go down mainly because of a number of uncertainties associated with the acquisition, such as turbulent integration process, lost productivity, additional debt or expense incurred and accounting issues (Investopedia, 2016a). Figure 6 demonstrates SSE’s stock prices after the acquisition of ESG was disclosed.
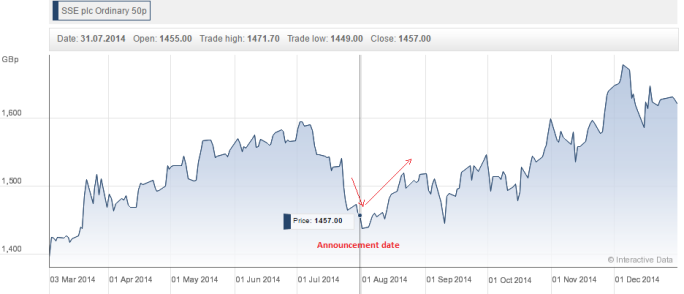
Figure 6: SSE’s stock price movements after acquisition of ESG
(Source: Hargreaves Lansdown, 2014)
As can be seen from the above figure, SSE’s stock prices witnessed decreases in two consecutive days after the acquisition and this conformed with the empirical studies’ implication mentioned earlier:
- On 31st July 2014: share price dropped from 1462.00 GBp to 1,457.00 GBp
- On 01st August 2014: share price continued to decline from 1,457.00 GBp to 1,438.00 GBp. This is the lowest of SSE’s closing prices since 19th March 2014.
Nevertheless, it is important to remember that the stock price’ behaviours after the acquisition is for short-term period only; if an acquisition goes smoothly, it will definitely benefit the company in the long run (Investopedia, 2016a). This may be the case of SSE when its stock price saw a sharp rise until the beginning of September 2014.
In the increasingly competitive market of energy industry, making acquisitions is an appropriate strategy of SSE in order to deliver business growth and enhance the company’s market power. Such acquisitions are expected to create value over long-term period as well as represent SSE’s concentration on sustaining a balanced range of energy business. This is in line with SSE’s Board of Directors’ consideration which emphasizes responsibility to shareholders for its strategic direction, values and governance (SSE, 2015a).
It is notable that some companies make deals of M&A for non-value enhancing motives such as hubris and empire building. Roll (1986) describes his hubris hypothesis which indicates over-confidence or less kindly, arrogance of managers. Meanwhile, empire building is seen when management is merely concerned with expanding their business rather than finding ways to benefit its shareholders (Investopedia, 2016b). Therefore, it is necessary for shareholders to justify company’s motivations in M&A transactions before making further investment decisions.
By employing SVA model, this financial report is able to come up with SSE’s intrinsic value which is lower than its market value. The discrepancy between the two values might be explained by Efficient Market Hypothesis and asymmetric information issue. The company stock will be given a “HOLD” rating given its potential energy projects in the near future as well as the prediction of rising energy prices. However, it is imperative that investors keep an eye on operating margin and WACC since the firm’s underlying value is highly susceptible to changes in these two variables. Moreover, SVA users should take extra consideration due to the model’s possible limitations in practice such as assumptions about constant sales growth and WACC. By combining SVA with other valuation techniques such as dividend valuation model or P/E share price valuation, investors may draw a bigger picture about the business potential so as to find investment opportunities.
SSE is on the right track to expand its influence in the energy sector by engaging in strategic activities like acquisitions. It can be observed that the acquisition of ESG is a reasonable approach for SSE to gain more competitive advantages. With respect to the firm’s shareholders, it is advisable that they watch out the company performance so that non-value motives such as hubris and empire building can be mitigated.
References
Arnold, G., 2013. Corporate Financial Management. 5th ed. s.l.:Pearson Education Limited.
Energy UK, 2016. Electricity Switching March 2016. [Online]
Available at: https://www.energy-uk.org.uk/publication.html?task=file.download&id=5759
[Accessed 20 January 2017].
Fama, E. F., 1970. Efficient Capital Markets: A Review of Theory and Empirical Work. Journal of Finance, 25(2), pp. 383-417.
Fernandez, P., Ortiz, A. & Acín, I. F., 2016. Market Risk Premium used in 71 countries in 2016: a survey with 6,932 answers. Social Science Research Network, p. 2017.
Financial Times, 2017. SSE PLC: About the company. [Online]
Available at: https://markets.ft.com/data/equities/tearsheet/profile?s=SSE:LSE
[Accessed 20 January 2017].
Fitch Ratings, 2016. Fitch Affirms SSE plc at ‘BBB+’; Stable Outlook. [Online]
Available at: https://www.fitchratings.com/site/pr/1009969
[Accessed 21 January 2017].
Goold, M. & Luchs, K. S., 1995. Managing the Multi-business Company: Strategic Issues for Diversified Groups. 1st ed. s.l.:Cengage Learning EMEA.
HMRC, 2016. Corporation Tax rates and reliefs. [Online]
Available at: https://www.gov.uk/corporation-tax-rates/rates
[Accessed 20 January 2017].
Investopedia, 2016a. What happens to the stock prices of two companies involved in an acquisition?. [Online]
Available at: http://www.investopedia.com/ask/answers/203.asp
[Accessed 27 January 2017].
Investopedia, 2016b. Empire Building. [Online]
Available at: http://www.investopedia.com/terms/e/empirebuilding.asp
[Accessed 28 January 2017].
Knoema, 2016. Crude Oil Price Forecast: Long Term 2016 to 2025 | Data and Charts. [Online]
Available at: https://knoema.com/yxptpab/crude-oil-price-forecast-long-term-2016-to-2025-data-and-charts
[Accessed 20 January 2017].
Ofgem, 2016a. Retail Energy Markets in 2016, s.l.: Consumers & Competition Team.
Ofgem, 2016b. Wholesale Energy Markets in 2016, s.l.: Energy Market Outlook Team.
Plesco & Sobol, 2013. The issue of asymmetric information upon the Capital Market. CES Working Papers, pp. 254-266.
Roll, R., 1986. The Hubris Hypothesis of Corporate Takeovers. The Journal of Business, Volume 59, pp. 197-216.
SSE, 2014. Acquisition of the energy solutions group. [Online]
Available at: http://sse.com/newsandviews/allarticles/2014/07/acquisition-of-the-energy-solutions-group/
[Accessed 27 January 2017].
SSE, 2015a. SSE plc Annual Report 2015. [Online]
Available at: sse.com/media/324575/SSEAnnualReport2015Web.pdf
[Accessed 20 January 2017].
SSE, 2015b. SSE’S PRELIMINARY RESULTS FOR THE YEAR TO 31 MARCH 2015. [Online]
Available at: http://sse.com/newsandviews/allarticles/2015/05/sses-preliminary-results-for-the-year-to-31-march-2015/
[Accessed 21 January 2017].
SSE, 2016a. SSE plc Annual Report 2016. [Online]
Available at: http://sse.com/media/404875/SSE_AnnualReport_2016.pdf
[Accessed 20 January 2017].
SSE, 2016b. SSE PLC INTERIM RESULTS FOR THE SIX MONTHS TO 30 SEPTEMBER 2016. [Online]
Available at: http://sse.com/newsandviews/allarticles/2016/11/sse-plc-interim-results-for-the-six-months-to-30-september-2016/
[Accessed 21 January 2017].
SSE, 2016c. WIND. [Online]
Available at: http://sse.com/whatwedo/wholesale/generation/renewables/wind/
[Accessed 20 January 2017].
World Bank, 2016. World Bank Commodity Forecast Price Data, July 2016. [Online]
Available at: http://pubdocs.worldbank.org/en/764161469470731154/CMO-2016-July-forecasts.pdf
[Accessed 20 January 2017].
Appendix 1: Share of generation output 2015

(Source: Elexon, NETA Reports, Ofgem analysis, 2015)
Market shares are calculated based on metered volumes associated with individual generation units (called Balancing Mechanism Units)
Appendix 2: Market share of GB electricity supply from 2006 to 2016, and snapshot for March 2016
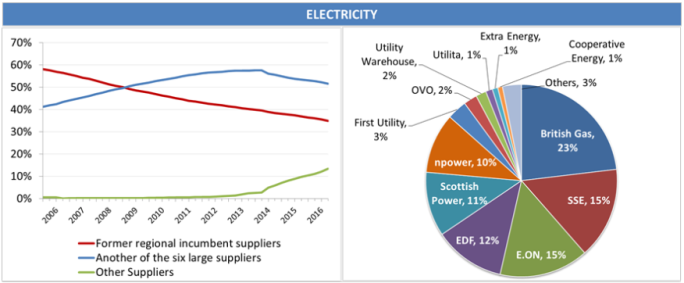
(Source: Ofgem analysis of data provided by DNOs, iDNOs and Xoserve, 2016)
Appendix 3: Market share of GB gas supply from 2006 to 2016, and snapshot for March 2016
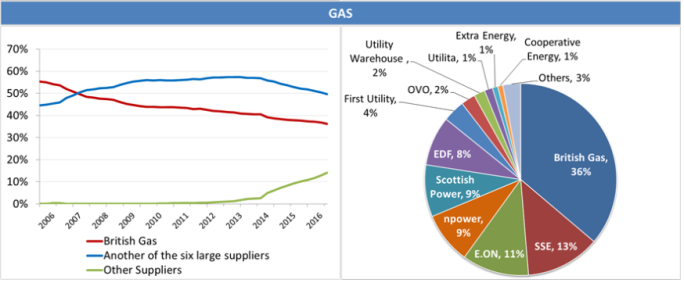
(Source: Ofgem analysis of data provided by DNOs, iDNOs and Xoserve, 2016)
Appendix 4: Entry in the domestic market between April 2015 and March 2016
Appendix 5: Energy customer account numbers – millions

(Source: SSE’s Annual Report 2016)
Appendix 6: SSE’s Sensitivity Analysis