The Power of Incentives
The development of renewable energy technology has significantly contributed to the increase in the amount of renewable energy consumed in the United States. Today, Americans consume more than double the amount of renewable energy consumed in 1975 and the industry continues to grow. In November of 2016, renewable energy made up 10.6% of total energy consumption (“Total Energy Data Analysis”, 2017).
Current trends in the supply and demand of renewable energy in the twenty-first century can be illustrated through analyzing the market from 2010 to 2013. Within these three years, U.S. government subsidies for renewable energy increased 54%, from $8.6 billion in 2010 to $13.2 billion in 2013 (“EIA Report: Subsidies Continue to Roll In For Wind and Solar – IER”, 2015). Additionally, consumer demand for renewable energy increased from 9.4% of total energy consumed in 2010 to 10.7% of total energy consumption in 2013 (“Total Energy Data Analysis”, 2017). Ultimately, the large subsidies led to a decrease in the market price for renewable energy.[1]
The shifts in the price of renewable energy can be assessed through analyzing increases in government subsidies to the industry and the increase in consumer demand. Subsidies were put in place to promote the growth of renewable energy firms. These subsidies allowed firms to become established in an industry in which the fixed costs are significant and success requires large economies of scale. As firms achieved larger economies of scale, the cost of producing forms of renewable energy technology became cheaper, while technology efficiency and quality improved. Subsidies shifted the supply curve rightward, and greatly reduced the price. This reduction in price led to an increase in demand as renewable energy became more affordable for consumers. Additionally, environmental conservation awareness may justify the increase in consumer demand for renewable energy over the past fifty years. Although this 1.3% increase in demand from 2010 to 2013 shifted the demand curve rightward, the resulting increase in price was offset by the large government subsidies shifting the supply curve rightward. The overall effect was a lower price for consumers as suppliers were encouraged to increase their output.
While this decrease in price may provide an incentive for more American consumers to buy renewable energy to power their homes, it also signals a future outcome that threatens the energy industry. According to a study featured in Energy & Environmental Science, the United States has the capacity to be powered by 100% renewable energy by 2050. Researchers predict that a transition to renewables would result in a 39% decrease in the overall demand for energy. The study cites both improvements in energy efficiency and reductions in energy used for the extraction and transportation of fossil fuels as main factors in the estimated decrease in demand (Jacobson et al., 2015). Such a decrease in demand would continue to lower prices for renewable energy. Additionally, such a future would alter the price elasticity of demand for renewable energy. With a society powered solely by renewables, the demand curve for renewable energy would become more inelastic. Therefore, government subsidies at their current levels would substantially reduce the price for renewable energy, compared to the market equilibrium price, in a market with inelastic demand. [2]
The future of renewable energy in 2050 does not benefit energy producing firms. While the U.S. government could reduce the amount of subsidies to the renewable energy industry to allow for a higher market price, this would hardly offset the effects of consumer demand. While the demand for renewable energy as a percentage of total energy consumed would increase from current levels if the U.S were to transition to 100% renewable energy, the demand for energy as a whole would decrease by a staggering 39%. Thus, the prospects for renewable energy firms seem grim. Without government subsidies, the market price of renewable energy is far too high for renewable energy firms currently attempting to become established. A nationwide shift to renewable energy would result in a net decrease in energy demand, effectively decreasing the price of energy. Along a transition to a future powered by renewable energy, the price of all energy decreases as the price of renewable energy decreases. Thus, there is little incentive for those in the energy industry to invest in renewable energy (“Clean Energy’s Dirty Secret”, 2017).
The current trends in the supply and demand for renewable energy seem to promise industry growth, yet the future of renewable energy is uncertain. Projections for 2050 indicate that a transition to 100% renewable energy across the United States would reduce total energy demand by nearly forty percent and thereby dramatically reduce the price of energy. The future success of the renewable energy industry depends on many elements including factors of supply and demand. Ultimately, firms will need to determine adequate strategies to adapt and grow in an industry in which many energy investors see limited opportunity.
Figure 1: Supply and Demand of Renewable Energy: 2010-2013
The demand curve shifts rightward from 2010 to 2013 as demand increases from 9.4% to 10.7% of total energy consumption (“Total Energy Data Analysis”, 2017). The supply curve shifts rightward as government subsidies lower the price of production for producers, with a subsidy of $8.6 billion in 2010 and $13.2 billion in 2013 (“EIA Report: Subsidies Continue to Roll In For Wind and Solar – IER”, 2015).
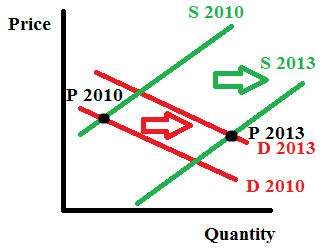
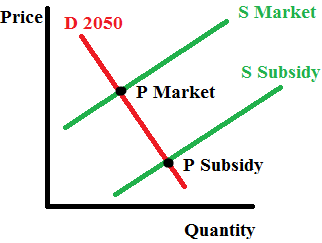
Figure 2: Supply and Demand of Renewable Energy: 100% Renewable 2050
The demand curve for renewable energy is approximately inelastic in 2050 as renewable energy encompasses the entire market for energy (Jacobson et al., 2015). The supply curves illustrate the effect of government subsidies on the price of renewable energy, with a higher price at market equilibrium than with government subsidies.
References
Clean Energy’s Dirty Secret. (2017). The Economist. Retrieved 25 February 2017, from
http://www.economist.com/news/leaders/21717371-thats-no-reason-governments-stop-su
pporting-them-wind-and-solar-power-are-disrupting
EIA Report: Subsidies Continue to Roll In For Wind and Solar – IER. (2015). Institute for Energy
Research. Retrieved 10 March 2017, from
http://instituteforenergyresearch.org/analysis/eia-subsidy-report-solar-subsidies-increase-
389-percent/
Jacobson, M., Delucchi, M., Bazouin, G., Bauer, Z., Heavey, C., & Fisher, E. et al. (2015). 100%
clean and renewable wind, water, and sunlight (WWS) all-sector energy roadmaps for the
50 United States. Royal Society Of Chemistry, 8(2093-2117), 1-3.
doi:10.1039/C5EE01283J
Krugman, P., & Wells, R. (2013). Economics (Third Edition ed.). New York, NY: Worth.
Total Energy Data Analysis. (2017). Independent Statistics & Analysis – U.S. Energy Information
Administration. Retrieved 9 March 2017, from
https://www.eia.gov/totalenergy/data/browser/?tbl=T01.03#/?f=M
[1] see Figure 1
[2] see Figure 2