Volcanic Ash Cloud Modelling Using Visual Basic Application
RESEARCH ARTICLE
Â
ABSTRACT
Recently, the study of volcanic eruption and ash cloud dispersion has become important due to the severe risks and hazards associated with it. The negative impact it has on human livelihood, infrastructure, transportation, water supply, farming, and the environment and the environment as a whole needs serious attention. This has prompted many researchers to investigate the dynamics of volcanic ash clouds by utilizing an objective methodology, utilizing high-spatial determination pictures and complimentary ground based observation. These models have being instrumental in understanding past eruptions and also for future prediction and planning to mitigate it effects. The models for ash cloud usually require some parameters for their stimulation which would be depends on the type of model or software to be used. For the purpose of this article, Visual Basic Application (VBA) software has been used to study the 2014 Mount Mayon eruption. The codes were developed using vent coordinate, diffusion coefficient, wind velocity, iteration and time step. The results from the simulation show the ash clouds dispersed in the NE direction. The results of the codes modelled showed diffusion and advection of ash plumes using a two dimensional array. Arcmap was used to output the results of the stimulation. Kernel density and spatial contour tools were also used to examine and interpretate the output of the simulation, showing the high risk of volcanic ash cloud in the Mount Mayon region. Visual Basic Application (VBA) was chosen for the study because it is simple, fast, convenient and affordable while proving to be equally accurate for modelling large particles. Nonetheless, the utilization of much more advanced models will provide more accurate results. Population growth and increase in urbanization in regions inclined to volcanic ash risks requires risk reduction and mitigation strategies.
 KEYWORDS: Volcanic Eruption, Mount Mayon, Hazard Modeling, Ash Cloud, Visual Basic Application.
1.0 INTRODUCTION
The objective of natural hazards and risks assessment is to determine the extent and nature of risk in a particular area by evaluating potential hazards that together could harm people destroy properties, goods and services (UNISDR, 2009). Various studies have identified society’s increasing vulnerability to disasters as a consequence of population expansion in hazardous areas and increasing economic and environmental strains (Rougier et al., 2013). The socio-economic and physical impact of volcanic ash on the environment is obviously massive. Studies and observations over the years have significantly enhanced our understanding as seen in the past 30 years (e.g., Soufrière Hills (Montserrat), 1995; Eyjafjallajökull (Iceland), 2010) (Vervaeck, 2012). The current effects that are associated with the volcano eruption have made the study of volcanic ash multidisciplinary. The negative impacts on human livelihood, infrastructure, transportation, power supply, agriculture, water and the environment has caused tremendous damages. In order to minimize risk in highly affected areas and improve on hazard assessment, there is the need to use effective modelling tools to gather information on key risk indicators in ash dispersion. Successful displaying devices for anticipating ash remains scattering and transport can significantly add to hazard assessment and mitigation of risk in exceptionally influenced regions (Andreastuti, Alloway & Smith, 2000). This aim of the study is to review the formation, movement and effects of the 2014 Mount Mayon eruption. The Visual Basic Application (VBA) software has been used for the modelling of ash cloud in the study area. The codes developed using input parameters seeks to demonstrate the possible pattern of the ash cloud dispersion with likely solutions.
1.1 STUDY AREA.
Mount Mayon (13°15′24″N 123°41′6″E) is an active stratovolcano in the province of Albay in Bicol Region, on the island of Luzon in the Philippines. Renowned as the “perfect cone” because of its symmetric conical shape, the volcano and its surrounding landscape was declared a national park on July 20, 1938, the first in the nation. Mayon is the main landmark and highest point of the province of Albay and the whole Bicol Region in the Philippines, rising 2,462 metres (8,077 ft.) from the shores of the Albay Gulf about 10 kilometres (6.2 mi) away. The volcano is geographically shared by the eight cities and municipalities of Legazpi, Daraga, Camalig, Guinobatan, Ligao, Tabaco, Malilipot and Santo Domingo (clockwise from Legazpi), which divide the cone like slices of a pie when viewed from above. Historically the Mt. Mayon region of the Philippines has also been particularly hard hit by lahars because of volcanic eruptions that produce ash deposits on steep volcanic slopes which may later become mobilized by heavy cyclonic rains (Orense 2007). Geologically, Mount Mayon rock type is Basalt to Olivine-bearing Pyroxene Andesite and Bicol Volcanic Chain tectonic setting. Mayon is the most active volcano in the Philippines and it is constantly degassing and has erupted violently 54 times in the last 400 years (Ramos-Villarta et al. 1985). Upper slopes are quite steep while slope angle diminishes in a very regular way with descent to sea level (Fano et al. 2007). Most eruptions involve large ashcloud discharges, though pyroclastic and lava flows are also common, and magma composition is basaltic to olivine-bearing pyroxene andesite.
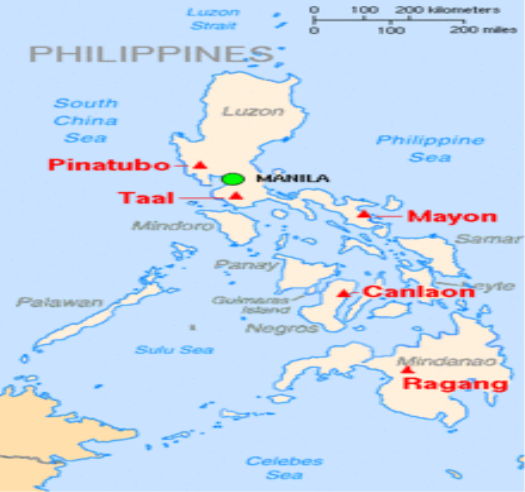
Figure1: Map of study area, Mount Mayon; Source (Google maps)
2. COMPREHENSIVE REVIEW OF THE RESEARCH LITERATURE
  2.1 INTRODUCTION AND OVERVIEW
The formation of volcanic ash is initiated by volcanic eruption events. Ash particle comprises of various sizes, elevation, and distances which disseminate into airspace. Ash cloud generates from a partial or complete eruption process (Cas & Wright, 1987 and move rapidly with speed of 10-65m/s, reaching high temperature of between 100 to 800oC (Blong, 1984) (Figure 2). Moreover, vast scale effects are related with volcanic ash cloud dispersion. Therefore, the assessment of volcanic ash hazards is essential in the socio-economic, scientific, and political affairs of any society more importantly in a region with dense population. The rise in population and increase in urbanization of areas prone to volcanic ash hazards demand the invention and application of suitable measures. Risk assessment and mitigation strategies must be enforced if major eruption is to be prevented (Baxter et al., 2008).
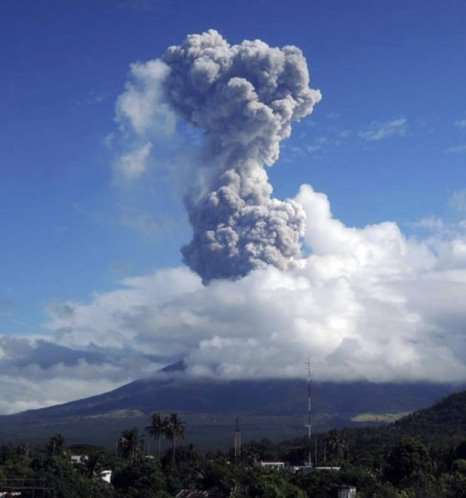
Figure 2: Mount Mayon 2014 ash cloud dispersion; Source google (Google images).
 2.2.1 BACKGROUND TO VOLCANIC ASH
    Volcanic ash is produced during volatile volcanic eruptions, phreatomagmatic eruptions and    movement in pyroclastic density currents. Explosive eruptions occur when magma decompresses as it rises, allowing dissolved volatiles to resolve into gas bubbles. Remote sensing results (Rose et al., 2000) and distal ash sampling studies (Durant et al., 20 09) strongly suggest that both ï¬Âne and very ï¬Âne ash mostly fall within a day of their eruption, much faster than fluid dynamics modeling suggests. Volcanic ash particles less than 2mm are pyroclast and particles greater than 2mm are lapilli. Regardless of the process of formation, volcanic ash are produced and determined by various factors such as particle size distribution, wind velocity, magma fragmentation and magma discharge. Altitude of 20-50km characterizes turbulent jets of explosive volcanic eruptions which convey ash and gas mixtures into the atmosphere (Carazzo & Jellinek, 2012). Particles aggregation is presumed to increase of fine ash fallout whereas sedimentation of pumice and ash particles is controlled by their separate settling velocities (Rose & Durant, 2011). Combined studies have shown that volcanic cloud ash mass decreases by an order of magnitude in 24 h (Rose et al., 2000).This rapid fallout of very ï¬Âne ash creates distal mass deposition maxima in tephra deposits at distances several 100s of km downwind(Brazier et al., 1983; Durant and Rose,). The distal ash sedimentation process is poorly understood but is clearly tied to meteorological processes that promote aggregation, e.g., hydrometeor formation, and influence cloud dynamics (Durant et al., 2009).
2.2.2 VOLCANIC ASH EFFECTS
2.2.2.1 Effects on Water Supplies
Effects of volcanic ash on water supplies have been critically severe that it makes livelihood unbearable. Studies describing these impacts are described fully in Stewart et al. (2006). Effects include physical blockages of intake structures by ash and damage due to abrasion or corrosion of equipment. The major public health concerns are thought to be the potential for outbreaks of waterborne infectious diseases due to the inhibition of disinfection by high levels of turbidity, and elevated concentrations of fluoride increasing risks of dental and skeletal fluorosis. Physical impacts of ash and problems due to high levels of acidity, turbidity and fluoride are well-documented; however, little attention has been paid to the other soluble components of volcanic ashfall and their potential consequences for water supplies. Water usage can be expected to increase significantly as affected communities begin cleanup operations (Johnston, 1997b; Johnston et al., 2004).
2.2.2.2 Effects on Agricultural Activities
Volcanic ash has a massive negative effect on farms since agricultural activities depend greatly on natural and irrigation means of water supply. Some farms are supplied by district or regional water supply schemes. Reported impacts on water supply schemes include (Johnston et al., 2004) suspended ash blocking intake filters, particularly for river-fed water supplies. This has put increasing pressure on water resources, especially for irrigation and stock water, requiring that the resource be actively managed. The uncommon unsettled climate and atmosphere at mid-scope in 1816 and 1817 had major financial effects, especially as far as a poor yield of horticulture creation, lack of healthy sustenance and considerably an expanded potential for infections and plagues (Trigo et al., 2009).
2.2.2.3 Effects on Infrastructure
About  nine percent of the world’s population lives within 100 km of a historically active volcano (Horwell and Baxter, 2006). This percentage will probably increase due to higher rates of population growth in many countries like Colombia, Ecuador and the Philippines that are highly volcanically active. Even though volcanic ash rarely endanger human life directly, it negative effects on critical infrastructure services such as electricity and water supplies, health facilities, transport routes, aviation, buildings and primary production, can lead to significant societal impacts (Horwell and Baxter, 2006 and Stewart et al., 2006). Moreover, fairly small eruptions can lead to widespread disruption, damage and economic loss. For example, the 1995/1996 eruptions of Ruapehu volcano in the central North Island of New Zealand were very small by geological standards but still covered over 20,000 km2 of land and caused significant disruption and damage to aviation, communication networks, a hydro-electric power scheme, electricity transmission lines, water supply networks, wastewater treatment plants, agriculture and the tourism industry (Cronin et al., 1998 and Johnston et al., 2000).
  2.3 ASH CLOUD MODELLING
Models have been utilized for decades to forecast ash fall during volcanic eruptions. However, it is only in recent years have tephra models like Ash3D been developed that use a 3-D, time-changing wind field, enabling us to model eruptions that last weeks and spread ash across an entire continent. These features, plus the development of a method for calculating growth of an umbrella cloud, have made it possible to simulate eruptions of this scale. Particles of ash are dispersed into the atmosphere in different directions during an explosive eruption, but the variation differences in altitude, wind speed and direction, and temperature are great influence (Carey and Sparks, 1986). Satellite based identification methods are presently used in monitoring eruptive plumes, but this practice has its limitations such as irregular satellites captures. The use of dispersal models to forecast both the deposition of ash particles on the ground and airborne is one important way of solving such challenges (Carey and Sparks, 1986). Observations measured from the ground are used to identify and examine volcanic ash clouds in addition to satellite data. New and evolving volcanic ash clouds have been detected using both specialized and well graded weather radar systems (Schneider et al, 2008). Volcanic Ash Transport and Dispersal models (VATD) are models that are mostly utilized for modelling volcanic ash and are extremely useful when simulating ash particles in order to reduce the risk and hazards posed by volcanic ash. These models are required to provide fairly accurate forecast and location of the volcanic ash and produce hazard maps fast enough to warn pilots of the danger routes (Peterson and Dean 2007). Also volcano observatories and Volcanic Ash Advisory Centres (VAAC) use these models to issue out forecast before, during and slightly after eruptions Generally, volcanic ash cloud models are tools that efficiently combine source input parameters in a short period of time and can be used to predict ash dispersion in an emergency situation and can help mitigate the risk and hazards related with such fallout during an eruption
2.4. ASH MODELLING PARAMETERS.
Volcanic ash cloud modeling need certain input parameters such as volcano location, date, time and duration of each eruption, source geometry, plume height, eruption rate, vertical ash distribution and particle size distribution. Plume height is simply the altitude at which most volcanic ash spreads laterally from the plume into the ash cloud. The relationship between plume height and eruption rate is possibly the most extensively studied among any sources parameters (Mastin et al., 2009). Theoretical studies (Morton et al., 1956) indicate that plume height should increase with eruption rate and empirical compilations ( Settle, 1978, Wilson et al., 1978 and Sparks et al., 1997, ) roughly follow this relationship. Some characteristic eruption parameters demonstrate extensive systematic relationships. Plume height increases with eruption rate and grain-size generally decreases with increasing silica content. However, not all relationships are systematic. The duration of eruptions may diminish or differ non-systematically with size of eruption or type of magma. For instance, an average grain size, whilst generally decreasing with increasing silica content, might as well decrease with increasing occurrence of pyroclastic flows (Dartevelle et al., 2002). Inefficiently captured variables such as wind, particle fallout, vent overpressure, or development of hydrometeors, together with atmospheric humidity for bigger eruptions might as well influence this relationship (Mastin et al., 2009).
3. METHODOLOGY
For the purpose of this study,Visual Basic for Application (VBA) was used to model the 2014 Mount Mayon volcano eruption ash cloud. Visual Basic for Application (VBA) is basically a software developed in Microsoft Excel and it is used for modelling volcanic ash particles dispersal. Generally, the model is considered to be fairly accurate in modelling volcano eruption. The model requires certain input parameters which are carefully manipulated to predict the likelihood of volcanic ash transport and dispersal. The model starts by defining a dimensional array size called “ashfall” and calling the parameters from the control panel created in the Excel spreadsheet. The particles are created by giving them an X and Y values, the X and Y values are the coordinates at the chosen location above the vent derived from the satellite imagery of the study area. Together with other input parameters such as wind speed and direction, diffusion coefficient, time and iterations,particles are advected and diffused along the X and Y axis  they are then outputted in a second work sheet called “ashfall”. The code then loops this process as it has been defined by the user, for the purpose of this report the particles were set to a random function. Once the simulation is completed the particle movement in the ash sheet is then plotted on a scatter graph to view the particles and the direction of dispersion. Both worksheets are then saved in MS-DOS comma separated (.csv) file format in Excel to make it possible to import into ArcMap. The satellite image obtained from http//www.landcover.org of the area is then displayed in the ArcMap and the X and Y values from the worksheets are then imported to display the ash. The kernel density function in the analysis tool calculates the density of the dispersed ash cloud. Moreover, time and iteration were considered to give a genuine situation of the ash dispersion. Below is a copy of the code used for simulation of the ash cloud.
Sub ashfall()
   Dim vent_x As Long, vent_y As Long
   Dim K As Single, vx As Single, vy As Single, dt As Single
   ‘K = diffusion coefficient’
   ‘dt = change in time’
   Dim max_inter As Long, no_part As Long
   Dim particles(1 To 1000, 1 To 2) As Single
   vent_x = Worksheets(“Control Panel”).Cells(1, 2)
   vent_y = Worksheets(“Control Panel”).Cells(2, 2)
   K = Worksheets(“Control Panel”).Cells(3, 2)
   vx = Worksheets(“Control Panel”).Cells(4, 2)
   vy = Worksheets(“Control Panel”).Cells(5, 2)
   dt = Worksheets(“Control Panel”).Cells(6, 2)
   max_iter = Worksheets(“Control Panel”).Cells(7, 2)
   ‘Worksheets on right side of = to plug values into code’
   For n = 1 To 1000
       particles(n, 1) = vent_x
       particles(n, 2) = vent_y
   Next n
   Offset = 0
   ‘so that numbers dont overwrite eachother at each iteration’
   For Iteration = 1 To max_iter
   ‘add nested loop for iterations – this allows all 1000 particles to be moved together in each step’
   ‘max_inter is set as 1000 in Excel’
       For n = 1 To 1000
       ‘Rnd = random generation of number between 0 and 1’
       ‘K = Diffusion Coefficent’
       ‘ash diffusion, where n,1 = x coordinate and n,2 = y coordinate’
       particles(n, 1) = particles(n, 1) + K * (0.5 – Rnd())
       particles(n, 2) = particles(n, 2) + K * (0.5 – Rnd())
       ‘ash advection’
       particles(n, 1) = particles(n, 1) + (vx * dt)
       particles(n, 2) = particles(n, 2) + (vy * dt)
       Worksheets(“Ashfall”).Cells(n + Offset, 1) = particles(n, 1)
       Worksheets(“Ashfall”).Cells(n + Offset, 2) = particles(n, 2)
       ‘worksheets on the left hand side of = to plug values in excel worksheet’
       Next n
       Offset = Offset + 1000
   Next Iteration
  End Sub
|
Input parameters |
Variables |
Values |
|
Start X |
  Long |
574207 |
|
Start Y |
  Long |
1465622 |
|
v x (m/s) |
  Single |
6 |
|
vy (m/s) |
  Single |
    9 |
|
Diffusion coefficient |
  Single |
     500 |
|
Iterations |
  Integer |
     1000 |
|
Time |
  Integer |
        10 |
Table 1: Input parameters, variables and values
used for the simulation of ash cloud for Mount Mayon
4. RESULTS OF SIMULATIONS
The ash cloud simulation outcomes are portrayed in figures 3 to 7 showing the wind direction, kernel ash density and spatial contours on Open Street map and Satellite map of Mount Mayon.
From the simulation, the wind velocity was in the NE direction as it can be seen in the maps. Due the magnitude of the ash cloud, nearby localities are in danger of high risk. Figures 3 and 4 depict the magnitude of the ash cloud in direction of the wind and the impact on the localities on both open street and satellites maps. Also, figure 5 on the other hand shows the levels density of the volcanic ash cloud dispersed in the study area. Regions that far away the volcano ash have minimal density of ash cloud and are not really at risk as compared to regions closer to the volcano ash with high level of density of ash cloud. With the aid of the spatial contour tool, figures 6 and 7 depicts the dispersed and settlement of the ash cloud on satellite map of the study area.
 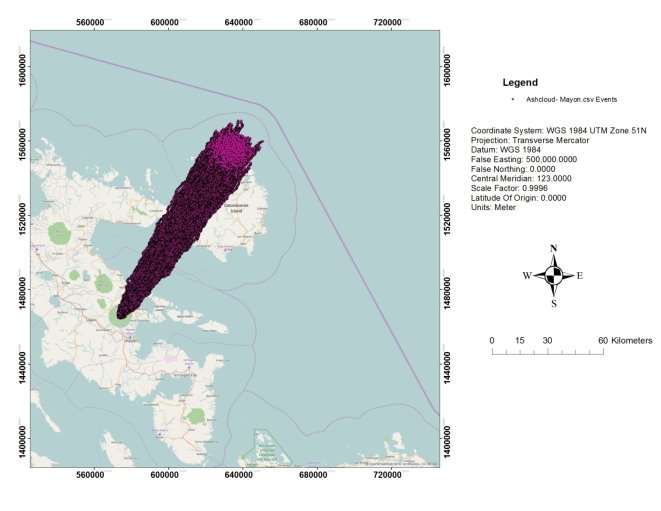
Figure 3: Open street map of Mount Mayon showing dispersed ash
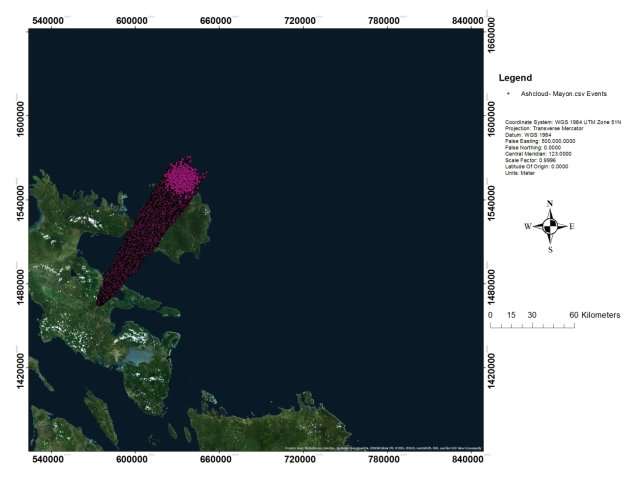
Figure 4: Satellite map of Mount Mayon showing dispersed ash.
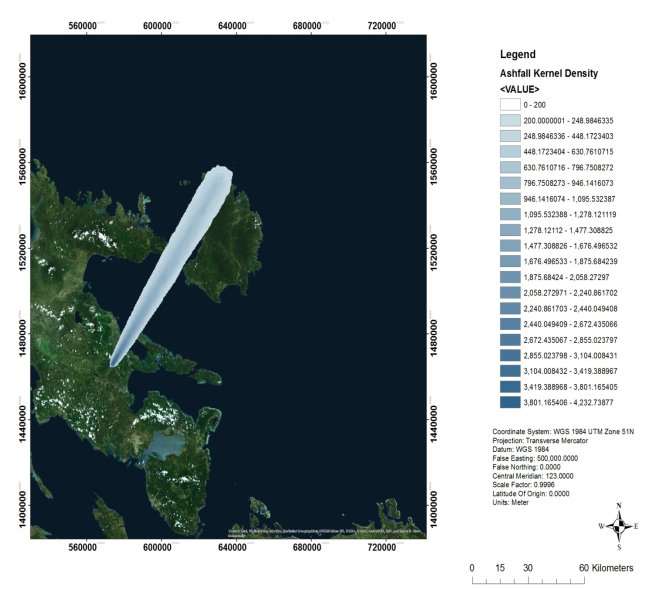
Figure 5: Satellite map of Mount Mayon showing kernel density of dispersed ash
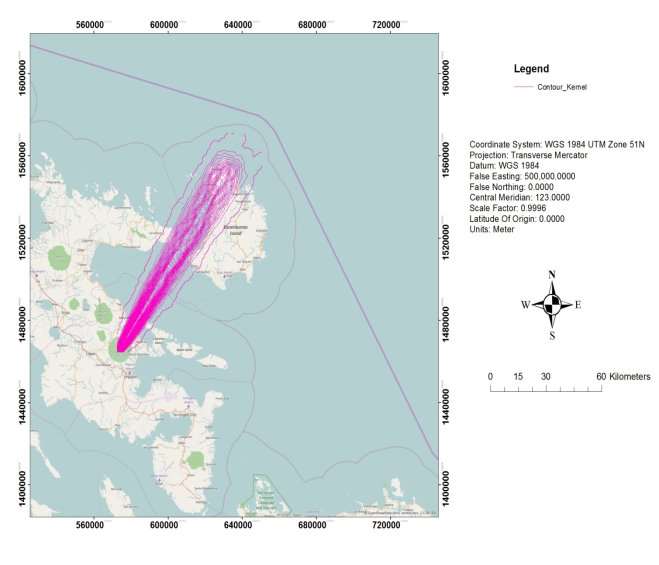
Figure 6: Open street map of Mount Mayo showing spatial contour of dispersed ash
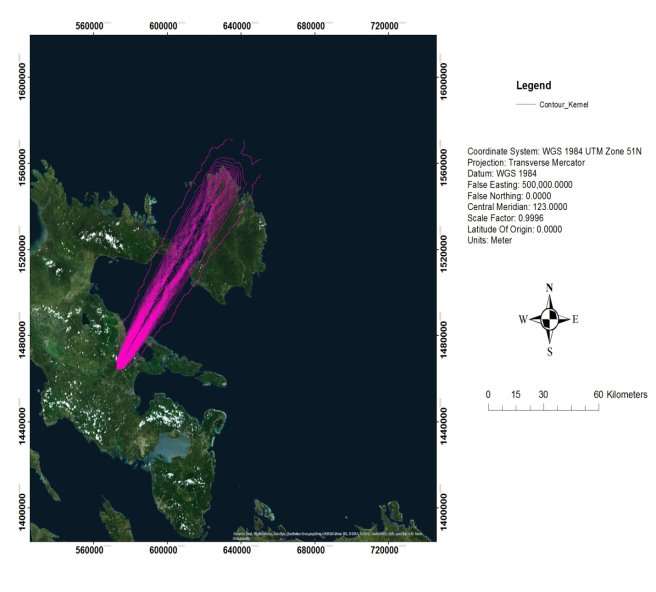
Figure 7: Satellite map of Mount Mayon showing the spatial contour of dispersed ash
5.1 HAZARD AND RISK IN STUDY AREA
The hazard and risk in Mount Mayon cannot be under-estimated since it is one of the active volcano in the Philippines erupting about 53 times in the past 400 years. There have death and displacement of hundreds of thousands of people since it first eruption in 1616. The record violent eruption in 1814 caused death of more than 1,200 people and destroyed several towns. Volcanic flows have caused broad destruction of water supply infrastructure and systems. Water pipes have been destroyed and concealed by lahars around Mayon volcano, Philippines (Nasol, 2001 and Smithsonian Institution, 2002). Chemical pollution of water takes place as tephra particles dissolve readily upon contact with water discharging ions (Witham et al., 2005 and Delmelle et al., 2007). Agricultural activities around Mount Mayon are affected by ash cloud dispersion which reduces crop field hence shortage of food supply. Air planes and other modes of transport are at risk of ash cloud since Legazpi Airport is only 42.8km from Mount Mayon. Lahars are possible to destroy vehicles as they move downstream while being influenced by debris (Blong, 1984). Also, tephra particles can cause damage to vehicles by roughening moving parts and obstructing air and oil filters (Wilson et al., 2012b).
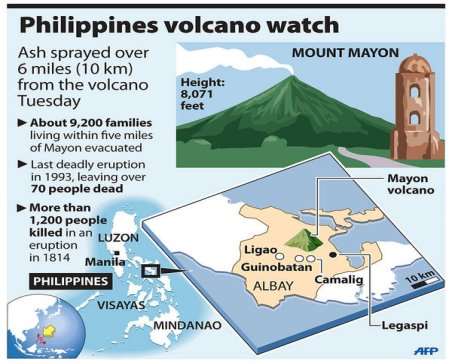
Figure 9: Hazard map of Mount Mayon ; Source (google maps).
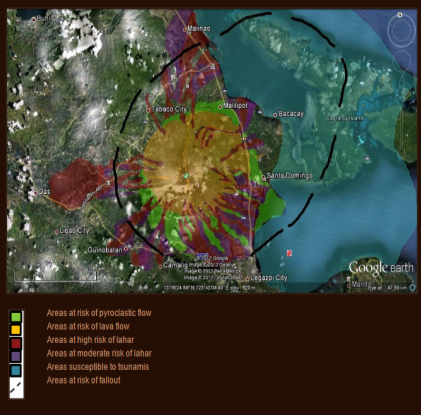
Figure 10: Hazard map of Mount Mayon ; Source (google earth).
5.2 EVALUATION OF HAZARD AND RISK IN STUDY AREA.
To mitigate the hazards and risks associated with volcano eruption, there must be implementation of policies and disaster control measures must be put in place. Minimizing the effects of volcanic eruptions on the study must be the fundamental objective of ash cloud hazard and risk management. Land-use pressure, population growth and society’s expectancy of infrastructure performance during and after disasters makes this a challenge. However, impacts of the 2014 Mount Mayon volcano eruption can by adopting the following strategies;
Creating awareness of volcanic risks and hazards and their impacts through communication strategies and educating the general public. This can be achieved through the use of both print media and electronic media. Also, Government must see to it that, projects and policies of building and planning are implemented effectively to eradicate indiscriminate and unauthorized building of houses and other structures in volcano prone areas. Evacuation plans, emergency response and temporary housing should be put in place to minimize the rate of fatalities associated with volcano eruption in the region. There should also be regular monitoring of volcanic eruption of the area by utilizing highly advanced models and high-tech machines as this will help predict upcoming eruption.
6. DETAILED DISCUSSIONS AND CRITICAL EVALUATIONS OF THE MODEL AND SOFTWARE.
The Visual Application Software (VBA) software developed from Microsoft Excel is basically easy to understand and quick to run for ash cloud modelling. It is also affordable and very instrumental for predicting the extent of ash cloud transport and dispersion utilizing input parameters according the user’s preferences. However, the software is is limited to the number of particles that can be modelled at the same time. Also, only one direction of ash cloud is dispersed at a particular time. The accuracy of the model could be improved if input parameters such as plume height and eruption rate are taken into account. When compared with other advanced models such as NAME, FALL3D and PUFF, Visual Application Software (VBA) cannot be used for continuous discharge of ash particles to model full volcano eruption but rather for single release of ash particles. Regardless of its limitations, Visual Application Software (VBA) software is still very useful for modelling ash cloud simulation.
7. CONCLUSIONS AND FUTURE WORK.
In conclusion, the hazard and risk associated with ash cloud transport and dispersion cannot be under-estimated in Mount Mayon. Therefore, proper planning and strategies must be put in place to mitigate the fatalities of volcano eruption in the future. Although the government responsible for major policies implementation, the general public together with non-governmental agencies must work hand-in-hand to minimize the negative impact of volcano eruption in the region. Despite the model limitations, Visual Application Software (VBA) is very useful tool for modelling volcanic ash cloud simulation. It is also easy to comprehend and fast but if other input parameters added to create a new, it will enhance it accuracy.
8. REFERENCE
Baxter, P., Boyle, R., Cole, P., Neri, A., Spence, R., & Zuccaro, G. (2005). The impacts of pyroclastic surges on buildings at the eruption of the Soufriere Hills volcano, Montserrat. Bulletin of Volcanology, 67(4), 292-313, available at .
Baxter, P., Aspinall, W., Neri, A., Zuccaro, G., Spence, R., Cioni, R., & Woo, G. (2008). Emergency planning and mitigation at Vesuvius: A new evidence-based approach. Journal of Volcanology and Geothermal Research, 178(3), 454-473.
Blong, 1984 R.J. Blong Volcanic Hazards: A Sourcebook on the Effects of Eruptions Academic Press, Sydney (1984).
Blong R (1996) Volcanic hazard risk assessment. In: Scarpa R, Tilling RI (eds) Monitoring and mitigation of volcanic hazards. Springer, Berlin Heidelberg New York, pp675-698.
Carey, S.,  Sigurdsson, H. (1982). Influence of particle aggregation on deposition of distal tephra from the May 18, 1980, eruption of Mount St. Helens volcano. J. Geophys, Res., 87 (B8), 7061.
Cronin et al., 1998 S.J. Cronin, M.J. Hedley, V.J. Neal, G. Smith Agronomic impact of tephra fallout from 1996 and 1996 Ruapehu volcanic eruptions, New Zealand Environmental Geology, 34 (1998), pp. 21-30.
Cronin et al., 2003 S.J. Cronin, V.E. Neall, J.A. Lecointre, M.J. Hedley, P. Loganathan
Environmental hazards of fluoride in volcanic ash: a case study from Ruapehu volcano, New Zealand Journal of Volcanology & Geothermal Research, 121 (2003), pp. 271-291
Dartevelle et al., 2002 S. Dartevelle, G.G.J. Ernst, J. Stix, A. Bernard Origin of the Mount Pinatubo climactic eruption cloud: Implications for volcanic hazards and atmospheric impacts
Geology, 30 (7) (2002), pp. 663-666.
Delmelle et al., 2007 P. Delmelle, M. Lambert, Y. Dufrêne, P. Gerin, N. Óskarsson
Gas/aerosol-ash interaction in volcanic plumes: new insights from surface analysis of fine ash particles Earth Planet. Sci. Lett., 259 (2007), pp. 159-170.
Durant, A.J., 2007. On Water in Volcanic Clouds. Ph.D. Thesis, Michigan Technological University, Houghton, Michigan, 242 pp.
Durant, A.J., Rose, W.I., 2009-this volume. Sedimentological constraints on hydro-meteor-enhanced particle deposition: 1992 eruptions of Crater Peak, Alaska.Journal of Volcanology and Geothermal Research.
Durant, A.J., Rose, W.I., Sarna-Wojcicki, A.M., Carey, S., Volentik, A.C., 2009-this volume.Hydrometeor-enhanced tephra sedimentation from the 18 May 1980 Mount St.Helens (USA) volcanic cloud. Journal of Geophysical Research.
Durant, A.J., Shaw, R.A., Rose, W.I., Mi, Y., Ernst, G.G.J., 20 08. Ice nucleation andoverseeding of ice in volcanic clouds. Journal of Geophysical Research 113
Horwell and Baxter, 2006 C.J. Horwell, P.J. Baxter The respiratory health hazards of volcanic ash: a review for volcanic risk mitigation Bulletin of Volcanology, 69 (2006), pp. 1-24
J. Rougier, R.S.J. Sparks, L. Hill Risk and uncertainty assessment for natural hazards
Cambridge University Press, Cambridge (2013) (588 pp.)
Johnston, D.M., 1997. The physical and social impacts of past and future volcanic eruptions in New Zealand. Unpublished PhD thesis, Massey University, Palmerston North, New Zealand.
Johnston, D.M., Houghton, B.F., Neall, V.E., Ronan, K.R., Paton, D., 2000. Impacts of the 1945 and 1995-1996 Ruapehu eruptions, New Zealand: an example of increasing societal vulnerability. Geological Society of America Bulletin 112, 720-726.
Johnston, D., Stewart, C., Leonard, G., Hoverd, J., Thordarsson, T., Cronin, S., 2004: Impacts of volcanic ash on water supplies in Auckland: Part 1. Institute of Geological and Nuclear Sciences, Lower Hutt, Science Report 2004/25, 83 pp.
Langmann, B., Folch, A., Hensch, M. and Matthias, V., 2012. Volcanic ash over Europe during the eruption of Eyjafjallajökull on Iceland, April-May 2010. Atmospheric Environment, 48, pp.1-8.
Mastin, 2002 L.G. Mastin Insights into volcanic conduit flow from an open-source numerical model Geochemistry, Geophysics, Geosystems, 3 (7) (2002) 10.1029
Mastin, 2007 L.G. Mastin A user-friendly one-dimensional model for wet volcanic plumes
Geochemistry, Geophysics, Geosystems, 8 (Q03014) (2007)
Mastin and Spiegel, in preparation Mastin, L.G., Spiegel, J., Ewert, J. W., Guffanti, M., in review. Spreadsheet of eruption source parameters for active volcanoes of the world, U.S. Geological Survey open-file report.
Morton et al., 1956 B.R. Morton, G.I. Taylor, J.S. Turner Turbulent gravitational convection from maintained and instantaneous sources. Proceedings of the Royal Society of London, Series A, 234 (1956), pp. 1-23.
Nasol, 2001 R. Nasol ‘Nanang’ aftermath, lahar destroys town’s water pipes Philippine Daily Inquirer, Philippines (2001)
Peterson, R., & Dean, K. (2008). Forecasting exposure to volcanic ash based on ash dispersion modeling. Journal of Volcanology and Geothermal Research, 170(3-4), 230-246.
Rodolfo, K.S., 1989. Origin and early evolution of lahar channel at Mabinit, Mayon Volcano, Philippines. Geological Society of America Bulletin, 101(3), pp.414-426.
Settle, 1978 M. Settle Volcanic eruption clouds and the thermal power output of explosive eruptions Journal of Volcanology and Geothermal Research, 3 (1978), pp. 309-324.
Smithsonian Institution, 2002 Smithsonian Institution Mayon – Bulletin of the Global Volcanism Network 27:04 (2002)
Sparks et al., 1981 R.S.J. Sparks, L. Wilson, H. Sigurdsson. The pyroclastic deposits of the 1875 eruption of Askja, Iceland Philosophical Transactions of the Royal Society of London, Series A, 999 (1981), pp. 241-273
S., Sparks, R.S.J., Carey, S.N., Sigurdsson, H., Westgate, J.A., 1983. Bimodal grainsize distribution and secondary thickening in air-fall ash layers. Nature (London)301 (5896), 115-119.
Sparks et al., 1997 R.S.J. Sparks, M.I. Bursik, S.N. Carey, J.S. Gilbert, L.S. Glaze, H.Sigurdsson, A.W. Woods Volcanic Plumes John Wiley & Sons, Chichester (1997) 574 pp.
UNISDR Terminology on Disaster Risk Reduction, United Nations, Geneva, Switzerland (2009)
Wilson et al., 1978 L. Wilson, R.S.J. Sparks, T.C. Huang, N.D. Watkins The control of volcanic column heights by eruption energetics and dynamics.
Witham et al., 2005 C.S. Witham, C. Oppenheimer, C.J. Horwell Volcanic ash-leachates: a review and recommendations for sampling methods J. Volcanol. Geotherm. Res., 141 (2005), pp. 299-326.
Wilson et al., 2012b T.M. Wilson, C. Stewart, V. Sword-Daniels, G. Leonard, D.M. Johnston, J.W. Cole, J. Wardman, G. Wilson, S. Barnard Volcanic ash impacts on critical infrastructure
Phys. Chem. Earth, 45 (2012), pp. 5-23.
Wilson, T.M.; Stewart, C. (2012). “Volcanic Ash”. In P, Bobrowsky. Encyclopaedia of Natural Hazards.