What are the Most Prevalent Dangers of Smoking and Drinking?
This work presents a research of the question “What are the most prevalent dangers of smoking and drinking?” In order to be understood and given an answer to this question, the report is based on open data, related to the topic and provided by the UK Government in data.gov.uk. All data in this web site are non-personal and in a format that allows it to be reused. The selected datasets here are explored, analysed and calculated by the use of R statistical software tool whereas Tableau – data visualization software tool, is used for presenting the data in a pictorial format.
The structure of the research is covering the following data visualisation life cycle, presented in figure 1 below.

Figure 1. Data Visualisation Life Cycle
Alcohol and cigarettes seriously threaten the health and are among the top causes of death. Among all risk factors for heart disease, people have the greatest control over those related to the use or abuse of alcohol and cigarettes. Multiple studies demonstrate that people who use or abuse with these substances have a significant increase in risk of developing heart disease.
The answer of this research question presents a range of information on drinking alcohol and smoking cigarettes which data is drawn together from different sources. The objective of the report is to present a wide picture of the health problems and dangers relating to the consumption of alcohol and cigarettes in England. The purpose of the data analysis and visualisation is to:
- Get closer to the data of alcohol and cigarettes consumption;
- Be understood the influence of smoking cigarettes and drinking alcohol;
- Enable decisions as it is much easier to be understood the potential risks of smoking and drinking by visualising the data;
- Discover patterns – to be shown how both ‘Alcohol’ and ‘Smoking’ hide almost one and the same dangers;
- Inspire action – the aim of this work is to visually demonstrate the dangers of smoking and drinking and can influence governments to improve the health care.
This research report contains data graphics analysed from different datasets published online at data.gov.uk, by the UK Government. These data graphics are analysed in R software tool and visualised by the use of Tableau software tool. The goal is to be demonstrated how the dangers and abuse of tobacco and alcohol are approximately one and the same. The collected information is from a variety of data sources and the intent is to be presented in a better and amicable format. Also, the report includes some analysis performed by the Health and Social Care Information Centre and some National Statistic publications. [1]
Selected Datasets:
- Statistics on Alcohol, England
This statistical record operates as a benchmark for the health issues relating to the alcohol use. The provided information is collected from different sources and is presented in a convenient format. It includes cases such as drinking habits and manner among adults (16 years old and over) and children (11 to 15 years old); ill health and death related to drinking; accessibility of alcohol; hospital admissions related to alcohol consumption. The record consists of previously published data and also comprises further new analysis. The recent analysis are primarily received from the Health and Social Care Information Centre’s (HSCIC) Hospital Episode Statistics (HES) system, and prescribing data. The statistics also comprises new records on the current government policies and aspirations related to the alcohol use. It also includes links to additional sources of valuable information. [6]
- Statistics on Smoking, England
This statistical record represents an assortment of information on smoking which is collected from different sources. The aim of this record is to present an extensive picture of the health problems related to smoking in England and includes themes such as smoking predominance, addictions, behaviours and style among adults and children, expenses, ill health and death related to smoking. This statistics incorporates data from a variety of sources representing it in a convenient format. It incorporates information and data formerly published by the Health and Social Care Information Centre (HSCIC), Department of Health, the Office for National Statistics and Her Majesty’s Revenue and Customs. The record also comprises new analyses performed by the Health and Social Care Information Centre. [2]
- Smoking, drinking and drug use among young people in England
This dataset is announced by the Health and Social Care Information Centre. Smoking, Drinking and Drugs use among Young People in England is an annual research executed in participating schools in England for providing information on scholars’ smoking, drinking and drug consumption behaviours. The study concentrates on different manners in different years, alternating between drinking and smoking one year, to drug consumption the next year. [3]
- Alcohol-related recorded crimes, violent crimes and sexual crimes, England
The three datasets [7], [8] and [9] contain a percentage respectively of the all recorded crimes, of the violent crimes and the sexual crimes per year, persons, all ages, per 1,000 population. The data are provided by the City of York Council and authorized by the Open Government Licence.
- Statistics on Women’s Smoking Status at Time of Delivery: England
This record represents the last outcomes and trends from the women’s smoking status at time of delivery (SATOD) data compilation in England. The outcomes provide a measurement of the predominance of smoking among pregnant women at Commissioning Region, Area Team and Clinical Commissioning Group level. This supplement the public data existing from the Infant Feeding Survey (IFS). The smoking in pregnancy can bring to significant pregnancy-related health issues such as complications during childbirth, greater risk of abortion, premature birth, low birth-weight and sudden unexpected death in early childhood. [4]
- Alcohol-related deaths in the United Kingdom
The data here is presented by the National Statistics Office and authorized by the Open Government Licence. This report provides the most recent data for alcohol-related deaths in the UK, its four composite countries and districts of England. Comparisons are made between 2012, and earlier provided information from 1991 onwards. [10]
- Deaths from smoking
This dataset is provided by the Department of Health and authorized by the Open Government Licence. The information for deaths due to smoking per 100,000 is provided by the Association of Public Health Observatories (APHO) Geographies: Local Authority District (LAD), County/Unitary Authority, Government Office Region (GOR), National Geographic coverage: England. [5]
The analysis implications are related to preparing the selected data, perception of the intended data characteristics, selecting a proper tool and technique, correctly using the tool, accurately presenting the data and making the right clarifications.
In order to be explored and appropriately visualized the answer of the research question are used the following steps:
- Analysing the entire open data, statistics and reports published in data.gov.uk;
- Selecting the appropriate datasets related to the research question;
- Downloading the selected datasets as an Excel files;
- Cleaning Data and preparing the excel files for analysis.
- 4.1 Normalization of the data formatting as raw data;
- 4.2 Removing the introductory text and additional information from the files;
- 4.3 Clearing the data files from blank spaces and unnecessary written sentences irrelevant
with the data analysis. - 4.4 Replacing the contained symbol for missing data (-) with the value 0 in the data fields;
- 4.5 The following three small datasets: “Alcohol-related recorded crimes”, “Alcohol-related violent crimes” and “Alcohol-related sexual crimes”, are gathered in one excel file with the aim to be analysed and visualised together;
- Converting all the excel files in .csv format;
Exploratory data analysis in R
“Exploratory data analysis is detective work (it) can never be the whole story but nothing else can serve as the foundation stone.” John Tukey ‘Exploratory Data Analysis’ (1977) [21]
The exploratory data analysis (EDA) is very important part in the data visualisation process as it detect mistakes, check assumptions, suggest possible statistical models and determine relationships between variables. Exploratory framework pertains to the following process sequence:
|
Data > Analysis > Model > Conclusion |
In this work the EDA is achieved with the help of R – statistical software tool, widely used and broad range of analysis capabilities. The main types of EDA are Univariate and Multivariate approaches and both can be non-graphical and graphical. Here the Multivariate analysis will be included only in the visualization part.
Univariate Approach
- “Alcohol related deaths”
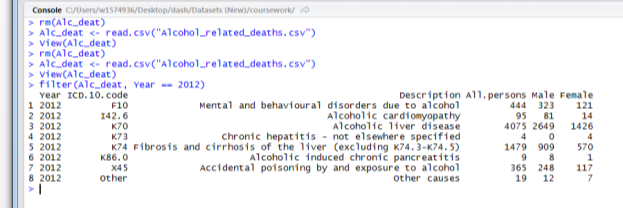
- Filtering the year in dataset “Alcohol related deaths” only for 2012 with the aim to be compared the data for “Smoking related deaths”.

- The STR function is used to display the inner structure of the data and diagnostics Str(Alc_deat), shows the internal structure of the dataset

- The head(Alc_deat) function is used to look at top few lines of the dataset (to see the data structure)

- The tail(Alc_deat) function is used to look at bottom few lines of the dataset (to see the data structure)

- Smoking related deaths
- Data set structure seems to be fine except value as this should be an integer and not a factor, therefore the value is changed to integer

- The function Smk_dea$Value = as.integer(Smk_deat$Value) is used forchanging the value to integer

-

 The function Summary(Smk_dea$ Metric_seconday) is used for summarising the most common causes of death related to smoking.
- The function sum(Smk_deat$Value) is used for calculating the amount of deaths caused by smoking

“ABOVE ALL ELSE SHOW THE DATA” – EDWARD TUFTE
According to Jacques Bertin the visualization is “…the artificial memory that best supports our natural means of perception”. [22]
And according to Cleveland and McGill, it is also “…categorical and quantitative information encoded, chiefly through position, shape, size, symbol and colour”. [21]
Data visualization is above all understanding relations and ratios between numbers. The data visualization is not about understanding particular numbers, but about understanding models, patterns, and relationships that exist in groups of numbers, “…the use of abstract, non-representational pictures to show numbers”, Edward Tufte. [22]
To meet and understand images is one of the common instincts of the human. From a well-drafted image, one is simpler to see the relationships and trends. As the visual production of the data takes advantage of the huge, and often underutilized, range of the human eye to get information from pictures and figures. The data visualization changes the load from digital analysing to visual analysing. Receiving information from visualizations is much more timesaving instead of analysing documents and sums – therefore many decision makers would prefer to get the data in graphical form instead of textual or written form.
In order to be explored and appropriately visualized the answer of the question “What are the most preventable dangers of smoking and drinking?” are used the following steps:
- Making a visual exploration of the data using Tableau Software, as follows:
- Connecting the excel data files;
- Creating Views and Analysis for each one of the files as separate worksheets and name appropriately every sheet;
- Representing the data in more effective way, applying filters, creating sets and groups, generating trend lines, using different visualization methods, such as: Bars, Lines, Plot, Pie, Stacked bars, etc. for better understanding;
- Using appropriate colours for good visualisation;
- Adding title and description (caption) to the graphics for better accepting;
- Gathering the worksheets and creating dashboards and/or data story.
In the visualization process are also taken of importance the following Tufte’s design principles: the data to be shown above all else, the data-ink ratio to be maximized, the non-data-ink to be erased, the redundant data-ink to be erased and finally the visualization to be revised and edited. [22]
The point of this report is to give a resolution of the question ‘What are the most prevalent dangers of smoking and drinking?’ and to strengthen the answer with real data and facts.
R has been used to analyse the data and its results helped to achieve the objective of the research and then Tableau was used to visualise the finding and complete the research question.
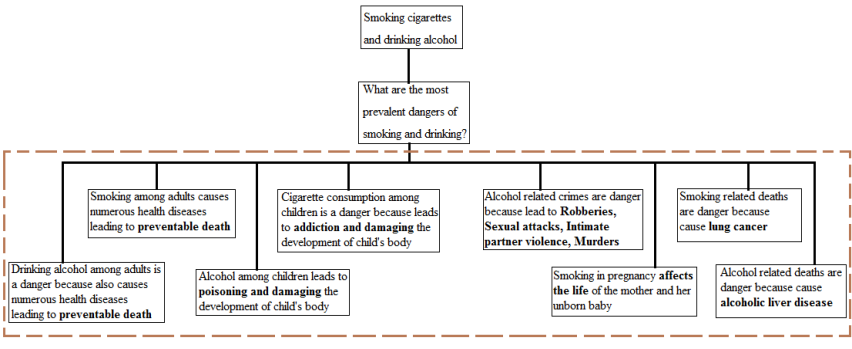
Well-structured stories expand the influence, make the data more rational and benefit the message retention. Thinking hard about the viewers the structure of the story follows inductive horizontal logic with similar grouped ideas:
- Smoking cigarettes and drinking alcohol
- What are the most prevalent dangers of smoking and drinking?
- Smoking among adults causes numerous health diseases leading to preventable death;
- Drinking alcohol among adults is a danger because also causes numerous health diseases leading to preventable death;
- Cigarette consumption among children is a danger because leads to addiction and damaging the development of child’s body;
- Alcohol among children leads to poisoning and damaging the development of child’s body;
- Alcohol related crimes are danger because lead to Robberies, Sexual attacks, Intimate partner violence, Murders;
- Smoking in pregnancy affects the life of the mother and her unborn baby;
- Smoking related deaths are danger because cause lung cancer;
- Alcohol related deaths are danger because cause alcoholic liver disease;

After the made analysis of the data related to alcohol and cigarettes consumption, it can be summarized that the steps in the horizontal logic (shown above) formalized similar grouped ideas which are de facto the key points (dangers), answering the question.
After associating several feedbacks, the result was suggesting the visualizations had unnecessary use of data ink, some of the graphics were with too bright colours and the audience had difficulties to get a clear picture of the figures, which are shown in the appendix. The redesign of the graphics included medium data ink, change of the colours from light to colour blind pallet for colour blind people and easier understanding of the images. Also, some of the bar charts were ordered by height as thus were represented the Gestalt features to allow the viewer to see the shapes without spending time to process the image.
In order to be answered the research question “What are the most prevalent dangers of smoking and drinking?” numerous statistical reports and datasets were explored. According to most of the sources, here are visually explained the top dangers of smoking and drinking.
Danger 1: Cigarette smoking among adults
Smoking damages the blood circulation and the heart. Also, increases the risk of: stroke, heart attack, coronary heart disease, peripheral vascular disease, cerebrovascular disease (damaged arteries that deliver blood to the brain). It can limit the blood supply to the penis and can cause impotence in men. It can also decrease the productivity of both men and women. [11]
Figure 1 demonstrates that people aged 20 to 24 and 25 to 34 reported the highest dominance of cigarette smoking (respectively 29% and 27%), while those aged 60 and over reported the lowest dominance, 13 percent. The data shown in figure 1.1 are an instance how the men are more likely to smoke than the women, 22% of the men report smoking versus 19% of the women.


Danger 2: Drinking alcohol among adults
Alcohol is ethanol which anaesthetizes the brain as a potent drug. In the bark area of the brain, it works as a relaxant and perverts the control, memory, learning ability, decisions and conduct. There is no doubt that long term use or abuse of alcohol causes inflammation and cirrhosis of the liver and also enhances the risk of kidney disease. [12]
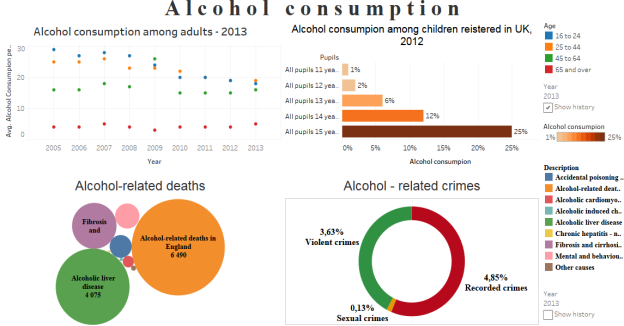
The results of the data here resemble those described above for smoking among adults, namely: people aged 16 to 24 and 25 to 44 have the highest frequency of alcohol consumption, while those who are 65 years old and over have the lowest. (Figure 2)

The data has changed and decreased in the years and in 2013 is recorded lower alcohol consumption from young adults aged 16 to 24 and 25 to 44 years old.

Danger 3: Cigarette smoking among children
The young people and teens are quite vulnerable to the deadly effects caused from the consumption of cigarettes because their body is still growing. Most of the people begin to try cigarettes before finishing their high school. So if the people stay smoke-free in school, they will likely never start smoking. [16]
-
Key findings for smoking among children, registered in UK.
From this data set, kids were asked whether they think it is ‘OK to try cigarettes to see what it is like’ or it is ‘OK to smoke cigarettes once a week’. The acceptability of smoking increases with the age. For instance, 6% of 11 years old think that it is ‘OK to try smoking to see what it is like’ in comparison with 57% (avg.) of 15 years old. The interesting finding here is that girls are more likely to try smoking cigarettes to see what it’s like than boys are. (Fig. 3)

Danger 4: Drinking alcohol among children
Alcohol can harm the development of young people’s body because it is still growing. This makes youths especially vulnerable to the long-time harm caused by the alcohol consumption.
Drinking alcohol in youth can harm the brain development. Most of the teens think that is not worth to worry about because the health risks caused by drinking are far in the future. Nevertheless, there is an acute rise in the amount of people in their twenties dying from liver disease as a score of alcohol abuse in their teens. The young people consuming alcohol are more likely to be involved in accidents and end in hospital because of alcohol poisoning. [15]
Key findings for drinking among children, registered in UK.
The summary of the dataset here shows that more prone to alcohol consumption are 15 years old children with the highest record of 25% (Figure 4). The data analysis on Figure 4.1 shows that boys and girls were equally likely to have drunk alcohol in 2014 (8%) which record was dramatically decreased since 2010 when the percentage was 13%.


Danger 5: Cigarette smoking during pregnancy
Smoking during pregnancy can put the health of the mother and her unborn baby at risk. The cigarette consumption can enhance the danger of: low birth weight; miscarriage; complications of pregnancy; premature birth; congenital defects in the baby (cleft palate); poorer growth, development and health of the child stillbirth or death within the first week of life. [20]
The dataset for Women’s Smoking Status at Time of Delivery (SATOD) gives information on the frequency of smoking among pregnant women in UK. The results here show that the lowest percentage, 12% of mothers recorded as smokers at the time of delivery (TOD), is registered in 2013/2014 which continues to decrease steadily from 15% in 2006-07 (Figure 5).
Regardless of the fact that the percentage of women who are smoking in pregnancy is measured less than those who do not smoke in pregnancy, the smoking at TOD definitely will stay a prevalent danger because it hides many health risks.

Danger 6: Alcohol – related crimes
The alcohol consumption is a very common factor related to most of the cases with criminal records. Many people find themselves involved in crimes after an intense drinking of large amount of alcohol intake because the ethanol has the aptitude to reduce the ability of making decisions, decrease the inhibitions and encourage aggressive inclinations. The most general alcohol-related crimes are cases of drinking and driving. However, there are many other significant violations that result from the abuse of alcohol. The most common alcohol-related crimes are: robberies, sexual attacks, intimate partner violence and murders. [13]
According to the Alcohol-related crimes dataset, in 2013 are recorded:
- 4.85% of alcohol-related recorded crimes;
- 0.13%Â of alcohol-related sexual crimes;
- 3.63% of alcohol-related violent crimes.

Danger 7: Smoking-related deaths
Smoking is one of the biggest causes of diseases and deaths in the UK. Annually, around 100,000 people in the UK die from smoking, and many others are living with exhausting smoking-related diseases. Smokers under the age of 40 have a 5 times higher risk of a heart attack than non-smokers. The cigarette consumption is a major reason of around 80% of deaths from lung cancer, around 80% of deaths from bronchitis and emphysema, and about 14% of deaths from heart disease. Almost all cancer deaths can be referred to smoking. For instance, cancer of the lung, throat, bladder, mouth, lip, pancreas, kidney, stomach, liver and cervix. Approximately half of all smokers will die earlier. Generally, the smokers die ten years younger than the people who do not smoke. [11]
Figure 7 shows that the most prevalent deaths are from cancers (3, 392, 696) followed by all diseases of the digestive system (2,761, 928), all circulatory diseases (2,059, 112) and all respiratory diseases (1,224,208).
Figure 7.1 shows that the larger proportion of deaths are among men.


Danger 8: Alcohol-related deaths
After smoking, the abuse of alcohol is the second most frequent reason of avertible death. The list below counts the causes of death which are related to alcohol consumption: [17]
- Figure 8 summarises that 6,490 alcohol-related deaths were registered in UK for 2012, an age consistent rate per 100,000 population.
- For both genders, males and females, it can be summarised that the most common cause of death from alcohol was the alcoholic liver disease with 4,075 registered deaths.
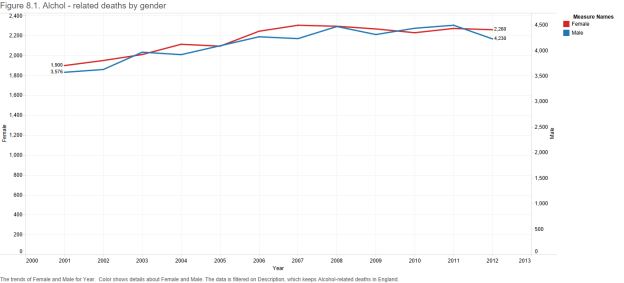
- 4,230 of alcohol-related deaths were among males compared with females which were 2,260 (Figure 8.1).


DATASETS:
- UK government open data. Available online on: https://data.gov.uk/
- Health and Social Care Information Centre. Dataset of “Statistics on Smoking, England”. Available online on: https://data.gov.uk/dataset/statistics_on_smoking_england
- Health and Social Care Information Centre. Dataset of “Smoking, drinking and drug use among young people in England”. Available online on: https://data.gov.uk/dataset/smoking_drinking_and_drug_use_among_young_people_in_england
- Health and Social Care Information Centre. Dataset of “Statistics on Women’s Smoking Status at Time of Delivery: England”, Available online on: https://data.gov.uk/dataset/statistics-on-womens-smoking-status-at-time-of-delivery-england
- Department of Health. Dataset of “Deaths from smoking”.
Available online on: https://data.gov.uk/dataset/deaths_from_smoking - Health and Social Care Information Centre. Dataset of “Statistics on Alcohol, England”. Available online on: https://data.gov.uk/dataset/statistics_on_alcohol_england
- City of York Council. Dataset of “Alcohol-related recorded crimes: Persons, all ages (per 1,000 population)”. Available online on: https://data.gov.uk/dataset/kpi-lape18
- City of York Council. Dataset of “Alcohol-related violent crimes: Persons, all ages (per 1,000 population)”. Available online on: https://data.gov.uk/dataset/kpi-lape19
- City of York Council. Dataset of “Alcohol-related sexual crimes: Persons, all ages (per 1,000 population)”. Available online on: https://data.gov.uk/dataset/kpi-lape20
- Office for National Statistics. Dataset of “Alcohol-related deaths in the United Kingdom” Available on: https://data.gov.uk/dataset/alcohol-related_deaths_in_the_united_kingdom
REPORTS & BOOKS :
- Health and Social Care Information Centre. Report, “Statistics on Smoking”, UK (2014)
- Health and Social Care Information Centre. Report, “Statistics on Alcohol”, UK (2015)
- Office for National Statistics. Report of “Violent Crime and Sexual Offences – Alcohol-Related Violence”, 2015
- Office for National Statistics. “Smoking and drinking among adults”, 2009
- Raphael Zahler, Caroline Piselli. “Smoking, alcohol, and drugs”, Chapter 6
- Public Health Research Consortium. Report of “A Review of Young People and Smoking in England”, 2009
- Office for National Statistics. “Alcohol Related Deaths in United Kingdom”, 2013
- Health and Social Care Information Centre. Report of “Smoking, drinking and drug use among young people in England”, 2014
- Office for National Statistics. Summary of responses to discussion paper “Defining alcohol – related deaths” , 2006
- Health and Social Care Information Centre. Report, “Statistics on Women’s Smoking at Time of Delivery: England “, 2015-16
- John W. Tukey. “Exploratory Data Analysis“, 1997
- Edward R. Tufte. “The Visual Display of Quantitative Information”
- William S. Cleveland and Robert McGill. “Graphical Perception: Theory, Experimentation, and Application to the Development of Graphical Methods”, 1984