WLB and WS of Employees in Nepalese Airline Companies
This chapter provides systematic presentation and analysis of primary data. Different statistical and regression model described in chapter three have been used for the study purpose. This section is divided into three sections. The first section deals with the presentation and analysis of the primary data and presents the results of questionnaire survey. The second section covers the analysis of regression model including correlation analysis. The third section of this chapter deals with concluding remarks associated on the basis of findings from primary data analysis.
4.1 Analysis and Presentation of data
This study is based on primary data analysis, which mainly deals impact of WLB and WS of employees in Nepalese Airline Companies. Work life balance and work satisfaction is two major dependent variables in the study. Work-family conflict and family-work conflict scales measured levels of interference between work and family lives, and high scores were indicative of high levels of conflict. Family satisfaction scale assessed levels of participants’ satisfaction with their family lives and their work, and high scores were indicative of high levels of satisfaction. Psychological health scale measured appearance of distress, and high scores were indicative of high levels of participants’ distress, therefore low levels of psychological health.
This section also reports the result of questionnaire survey conducted among employees of Nepalese Airline companies. Questionnaire survey was designed to understand the views of the respondents in relation to their Work Life Balance and WS. A set of questionnaires including multiple choices were provided. The respondents profile along and result of the survey are presented in the following sections. The percentage, frequency, cross tabulate, correlation, regression and reliability value has been calculated to do the proper analysis of the data.
4.1.1 Gender of respondent: Gender of the respondents plays an important role in understanding views of employees. Male and female are the respondents according to gender. Out of the total 105 respondents, majorities (50.5 percent, frequency 53) of the respondents are female followed by (49.5 percent, frequency 52) of the respondents are male. The classification of the respondents by gender in terms of percent is shown in figure 4.1.
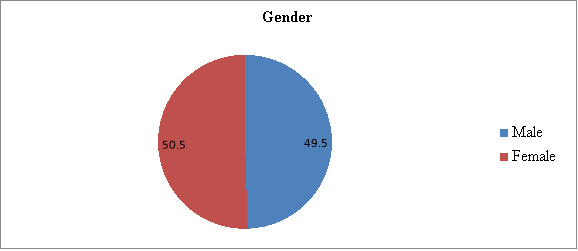
Source: SPSS results based on responses on survey questionnaire
Figure 4.1: Gender of the respondents
(The figure shows the gender of the respondents in terms of percentage)
4.1.2 Age of the respondents: The classification of the respondents by age in terms of percent is shown in figure 4.2 from the source SPSS. 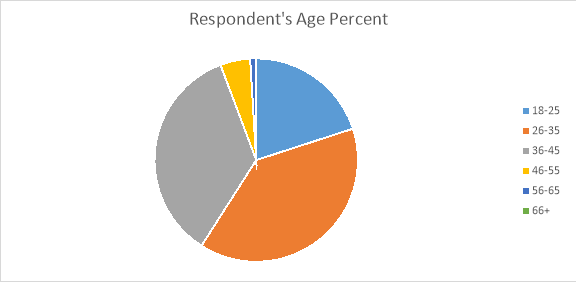
Source: SPSS results based on responses on survey questionnaire
Figure 4.2: Classification of respondents by age.
(The figure shows classification of respondents by their age in terms of percentage.)
Age of the respondents is one of the most important characteristics in understanding the views about the employees towards WLB and WS. The age group of the respondents is categorized into six groups i.e. 18-25 years, 26-35years, 36-45 years, 46-55 years, 56-66 years and 66+ with 20, 39, 35.2, 4.8, 1 and 0 percentage of respondents respectively.
4.1.3 Marital Status of respondent: Marital status of the respondents is one of the most important characteristics in understanding the views about the employees towards WLB and WS. The respondents is categorized into three groups i.e. single, married/cohabiting and divorced with 21, 77.1 and 1.9 percentage of respondents respectively. The classification of marital status in terms of percent is shown in figure 4.3
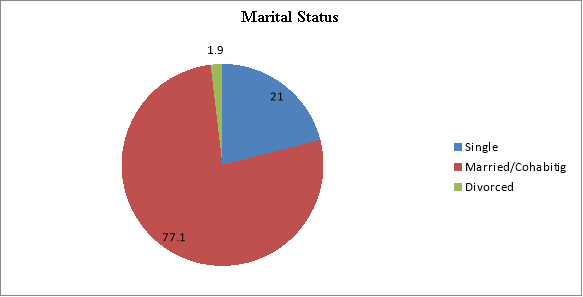
Source: SPSS results based on responses on survey questionnaire
Figure 4.3: Classification of respondent’s marital status
(The figure shows classification of respondent’s marital status in terms of percentage.)
4.1.4 Respondent’s offspring: Respondent’s having or not having children/offspring is important to know for this survey as the level of WLB and WS is perceived differently by both the group. The respondents are categorized into two groups i.e. respondents having offspring and respondents not having offspring with 21 and 79 percentage of respondents respectively. The classification of marital status in terms of percent is shown in figure 4.4.
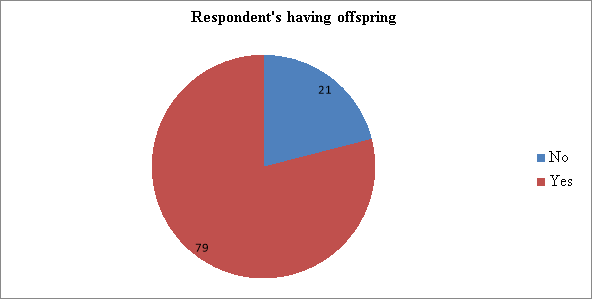
Source: SPSS results based on responses on survey questionnaire
Figure 4.4: Classification of respondents having offspring
(The figure shows classification of respondents having offspring in terms of percentage.)
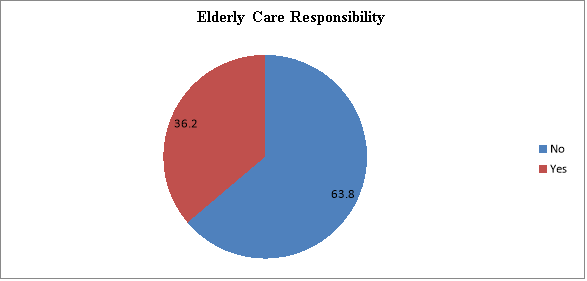
4.1.5 Respondents having elderly relative’s responsibility: The respondents are categorized into two groups i.e. respondents having elderly relative’s responsibility and respondents not having elderly relative’s responsibility with 63.8 and 36.2 percentage of respondents respectively. The classification of respondents’ having elderly care responsibility in terms of percentage is shown in figure 4.5.
Source: SPSS results based on responses on survey questionnaire
Figure 4.5: Classification of respondents having elderly care responsibility
(The figure shows classification of respondents having elderly care responsibility in terms of percentage.)
Respondent’s having or not having responsibility for elderly relative’s care is important to know for this survey as the level of WLB and WS is perceived differently by both the group. The respondents is categorized into two groups i.e. respondents having elderly care responsibility and respondents not having elderly care responsibility with 63.8 and 36.2 percentage of respondents respectively.
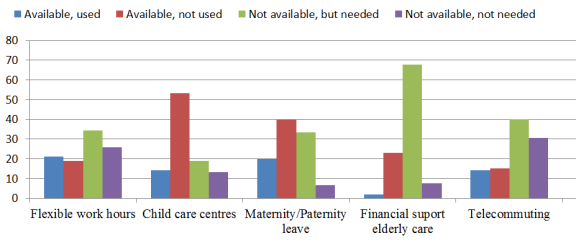
 4.1.5 Response for Work life Balance: In this section of the questionnaire, employees of Nepalese Airline Companies were asked questions relating to work life balance to understand the present situation of employees work life balance. For this purpose five questions were asked which relates to work life balance, namely flexible work timing, telecommuting, child care facility near office location, paid maternity or paternity leave and financial support for elderly care. These questions were responded in four categories namely, available and used, available and not used, not available but needed, not available and not needed. The classification of the respondents by work life balance in terms of percent is shown in figure 4.6
Source: SPSS results based on responses on survey questionnaire
Figure 4.6: Response for Work Life Balance in percentage
(The figure shows the view of respondents towards work life balance through various factors: flexible work hours, child care centers near office location, paid maternity or paternity leave, financial support for elderly care and telecommuting)
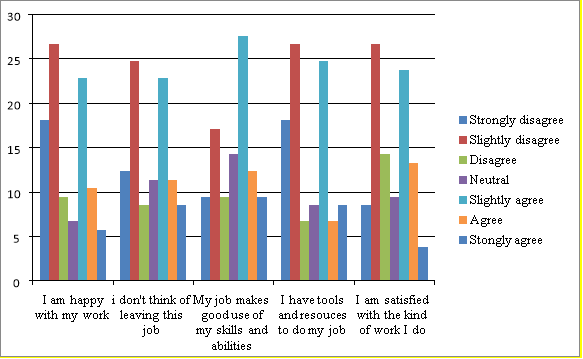
4.1.6 Response for Work Satisfaction: In this section of the questionnaire, employees of Nepalese Airline Companies were asked questions relating to WS to understand the present situation of employees WS. For this purpose five questions were asked which relates to WS of employees, namely employees are happy with their job, they don’t think of leaving their job, their job makes good use of their skills and abilities, they have tools and resources to do their job and they are satisfied with the kind of work they do. These questions were responded in seven scales namely, strongly disagree, neutral, slightly agree, agree, and strongly agree. The classification of the respondents by WS in terms of percent is shown in figure 4.7
Source: SPSS results based on responses on survey questionnaire
Figure 4.7: Response for Work Satisfaction in percentage
(The figure shows the view of respondents towards work satisfaction through various factors; employees are happy with their job, they don’t think of leaving their job, their job makes good use of their skills and abilities, they have tools and resources to do their job and they are satisfied with the kind of work they do).
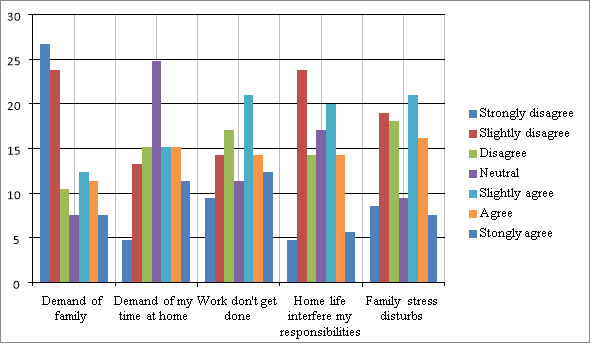
4.1.8 Response for Family Work Conflict: In this section of the questionnaire, employees of Nepalese Airline Companies were asked questions relating to work family work conflict to understand the present situation of employees family work conflict. For this purpose five questions were asked which relates to family work conflict of employees, namely demand of family won’t interfere work, employees don’t have to put off work because of demand of their time at home, work won’t get done because of demand of family, home life won’t interfere my responsibilities, family stress don’t disturb my ability to perform job. These questions were responded in seven scales namely, strongly disagree, slightly disagree, disagree, neutral, slightly agree, agree, and strongly agree. The classification of the respondents by WS in terms of percent is shown in figure 4.7
Source: SPSS results based on responses on survey questionnaire
Figure 4.8: Response for Work Family Conflict in percentage
(The figure shows the view of respondents towards family work conflict through various factors; demand of family won’t interfere work, employees don’t have to put off work because of demand of their time at home, work won’t get done because of demand of family, home life won’t interfere my responsibilities ,family stress don’t disturb my ability to perform job).
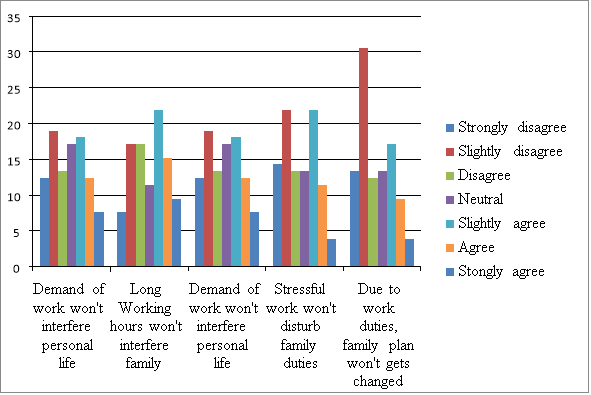
4.1.9 Response for Work Family Conflict: In this section of the questionnaire, employees of Nepalese Airline Companies were asked questions relating to work family conflict to understand the present situation of employees family work conflict. For this purpose five questions were asked which relates to work family conflict of employees, namely demand of work won’t interfere family, long working hours won’t interfere family responsibilities, demand of work won’t interfere personal life, stressful work does not make difficult to fulfill family duties, due to work life duties family plans don’t get changed. These questions were responded in seven scales namely, strongly disagree, slightly disagree, disagree, neutral, slightly agree, agree, and strongly agree. The classification of the respondents by WS in terms of percent is shown in figure 4.9
Source: SPSS results based on responses on survey questionnaire
Figure 4.9: Response for Work Family Conflict in percentage
(The figure shows the view of respondents towards family work conflict through various factors; demand of work won’t interfere family, long working hours won’t interfere family responsibilities, demand of work won’t interfere personal life, stressful work does not make difficult to fulfill family duties, due to work life duties family plans don’t get changed).
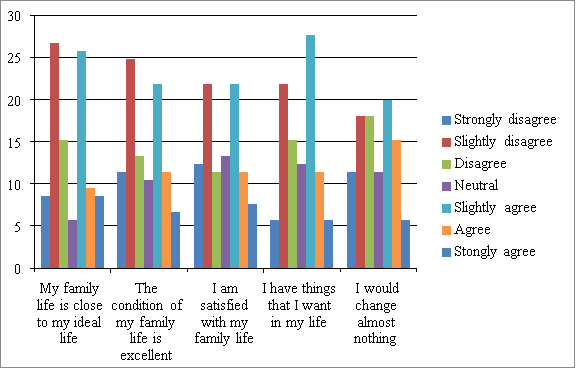
4.1.10 Response for Family Satisfaction In this section of the questionnaire, employees of Nepalese Airline Companies were asked questions relating to family satisfaction to understand the present situation of employees family satisfaction. For this purpose five questions were asked which relates to family satisfaction of employees, namely employee’s family life is close to their ideal life, the condition of their family life is excellent, they are satisfied with their family life, they have things that they want in their life and they would change nothing in their life. These questions were responded in seven scales namely, strongly disagree, slightly disagree, disagree, neutral, slightly agree, agree, and strongly agree. The classification of the respondents by WS in terms of percent is shown in figure 4.10.
Source: SPSS results based on responses on survey questionnaire
Figure 4.10: Response for Family Satisfaction in percentage
(The figure shows the view of respondents towards family satisfaction through various factors; employee’s family life is close to their ideal life, the condition of their family life is excellent, they are satisfied with their family life, they have things that they want in their life and they would change nothing in their life).
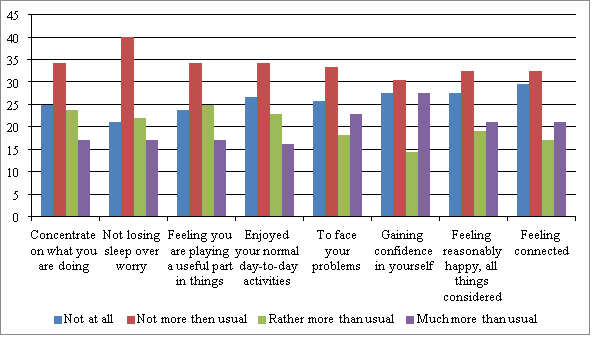
4.1.11 Response for Psychological Health In this section of the questionnaire, employees of Nepalese Airline Companies were asked questions relating to psychological health to understand the present situation of employees psychological health. For this purpose eight questions were asked which relates to psychological health of employees, namely have employees recently been able to: concentrate on what they are doing, not losing sleep over worry, feeling you are playing a useful part in things, enjoyed normal day to day activities, to face problems, gaining confidence in themself, feeling reasonable happy all thing considered and feeling connected to people. These questions were responded in four scales namely, not at all, not more than usual, rather more than usual, much more than usual. The classification of the respondents by WS in terms of percent is shown in figure 4.10
Source: SPSS results based on responses on survey questionnaire
Figure 4.11: Response for Family Satisfaction in percentage
(The figure shows the view of respondents towards family satisfaction through various factors; have employees recently been able to: concentrate on what they are doing, not losing sleep over worry, feeling you are playing a useful part in things, enjoyed normal day to day activities, to face problems, gaining confidence in themself, feeling reasonable happy all thing considered and feeling connected to people).
4.2 Cross tabulate table analysis
The cross tabulate table analysis is a tool that allows comparing relationship between two variables. Cross-tabulation analysis, also known as contingency table analysis, is most often used to analyze categorical (nominal measurement scale) data. A cross-tabulation is a two (or more) dimensional table that records the number (frequency) of respondents that have the specific characteristics described in the cells of the table. Cross-tabulation tables provide a wealth of information about the relationship between the variables.
4.2.1 Cross tabulation between Gender and Age of Respondent: The below table shows the cross tabulation between respondent’s gender and age.
Table 4.1
Cross tabulation between gender and age of respondent.
|
Age of Respondent |
Total |
||||||
|
18-25 |
26-35 |
36-45 |
46-55 |
56-65 |
|||
|
Gender |
Male |
10 |
18 |
23 |
1 |
0 |
52 |
|
Female |
11 |
23 |
14 |
4 |
1 |
53 |
|
|
Total |
21 |
41 |
37 |
5 |
1 |
105 |
|
Source: SPSS results based on responses on survey questionnaire
The above table 4.1 shows that 21 of respondents are from the age group 18-25 where 10 are male and 11 are female, similarly, 41 of the respondent are from age group 26-35 where 18 of them are male and the rest are female. Accordingly, 37 of the respondent are from age group 36-45 where 23 of them are male and 14 are female, whereas only five respondents are from age group 46-55 in which four of them are female and only one respondent is from age group 56-65 who is a female.
4.2.2 Cross tabulation between Age and Marital Status of Respondent: The below table shows the cross tabulation between age of respondent and marital status of respondent:
Table 4.2
Cross tabulation between Age and Marital Status of respondent.
Cross Tabulation between Age and Marital Status of Respondent
|
Age of Respondent |
Marital Status |
Total |
|||
|
Single |
Married/Cohabiting |
Divorced |
|||
|
18-25 |
15 |
6 |
0 |
21 |
|
|
26-35 |
7 |
34 |
0 |
41 |
|
|
36-45 |
0 |
35 |
2 |
37 |
|
|
46-55 |
0 |
5 |
0 |
5 |
|
|
55-65 |
0 |
1 |
0 |
1 |
|
|
Total |
22 |
81 |
2 |
105 |
|
Source: SPSS results based on responses on survey questionnaire
The above table shows that the respondents are mostly from age group 36-45 who are married or cohabitating, along with this the second highest recorded respondent are from age group 26-35 who are married or cohabitating. The least recorded respondents are divorced with only two respondents.
4.2.3 Cross tabulation between Respondent’s Gender and Offspring: The below table shows the cross tabulation between gender and offspring of respondent:
Table 4.3
Cross tabulation between Gender and offspring of respondent.
|
Gender |
Respondent’s Offspring |
Total |
|
|
No |
Yes |
||
|
Male |
10 |
42 |
52 |
|
Female |
12 |
41 |
53 |
|
Total |
22 |
83 |
105 |
Source: SPSS results based on responses on survey questionnaire
The above table shows that both male and female with offspring is recorded with 42 respondents for male and 41 for female. According to the data respondents with no children for male is 10 respondents and for female is 12.
The correlation analysis has been carried out to examine the direction and magnitude of the WLB and WS of employees of Nepalese Airline Companies. The correlation measures the strength of the linear relationship between variables. The Kendall’s tau-b correlation coefficient of different independent variables with work life balance and WS has been presented in table 4.4 and 4.5 respectively.
4.3.1 Correlations analysis for Work Life Balance: The Kendall’s tau-b correlation coefficient of different independent variables with WLB has been presented in table 4.4.
Table 4.4
Kendall’s tau-b correlation coefficients for the dependent variable (WLB) and independent variables.
(This table presents Kendall’s tau-b correlation coefficients for between work life balance of individuals employed in Nepalese Airline Companies. Factors from work life balance consists FWC as family work conflict, FS as family satisfaction, WFC as work family satisfaction and PH as psychological health)
|
Kendall’s tau b |
WLB |
FWC |
FS |
WFC |
PH |
||
|
WLB |
Correlation Coefficient |
1.000 |
|||||
|
Sig. (2-tailed) |
. |
||||||
|
FWC |
Correlation Coefficient |
-.617 |
1.000 |
||||
|
Sig. (2-tailed) |
.001 |
. |
|||||
|
FS |
Correlation Coefficient |
.57 |
.67 |
1.000 |
|||
|
Sig. (2-tailed) |
.032 |
.042 |
. |
||||
|
WFC |
Correlation Coefficient |
-.819 |
.57 |
.33 |
1.000 |
||
|
Sig. (2-tailed) |
.001 |
.013 |
.042 |
. |
|||
|
PH |
Correlation Coefficient |
.54 |
-.403 |
.526 |
-.055 |
1.000 |
|
|
Sig. (2-tailed) |
.060 |
.064 |
.019 |
.044 |
. |
||
Source: SPSS results based on responses on survey questionnaire
The result shows that there is positive relationship between work life balance and family satisfaction, which indicates that when family satisfaction is also observed, WLB of an individual employed at Nepalese Airline companies is ideal (availability of flexible working hours, telecommuting, child care centers near office location, paid maternity/paternity leave/ and financial support for elderly care). In this result, family satisfaction is the state of the employee’s perceived happiness where the employees’ ideal life consists of family life, condition of family life is excellent and satisfied, employee has got everything that he or she wants in their life and nothing would be likely to change by the employee therefore, when these are observed in employees’ life there is likely to have WLB.
Similarly, WLB also have positive relationship with psychological health which indicates that appropriate psychological health of an employee should bring WLB. In this result psychological health is the state of employee’s mental health free from depression, anxiety or any mental disorder. This result indicates that better psychological health in an employee such as better concentration level, better sleep with no worries, feeling of playing a useful part, being able to enjoy normal day-to-day activities and being confident results in better WLB.
The result shows negative relationship between WLB and family work conflict which indicates that when family work conflict exist in employee’s life, there is likely to be work life imbalance in employee’s life. The employees of Nepalese Airline Companies are likely to have work life imbalance when there is family work conflict. When family related stress, interference and demands are likely to be high, WLB is assumed to be not appropriate.
Likewise WLB has negative relationship with work family conflict which shows that when employee faces work family conflict there is work life imbalance. The employees of Nepalese Airline Companies are likely to have work life imbalance when there is work family conflict. When work related stress, interference and demands are likely to be high, WLB is assumed to be not appropriate.
4.3.2 Correlations analysis for WS: The Kendall’s tau-b correlation coefficient of different independent variables WS has been presented in table 4.5. The results obtained focuses on assessing how four variables, namely: work-family conflict, family-work conflict, family satisfaction and psychological health relate to establish the relationship with WS of individuals employed in Nepalese Airline Companies.
Table 4.5:
Kendall’s tau-b correlation coefficients for the dependent variable (WS) and independent variables
(This table presents Kendall’s tau-b correlation coefficients for between work satisfation of individuals employed in Nepalese Airline Companies. Factors from WS consists FWC as family work conflict, FS as family satisfaction, WFC as work family satisfaction and PH as psychological health)
|
Variables |
WS |
WFC |
PH |
FWC |
FS |
|
|
WS |
Correlation Coefficient |
1.000 |
||||
|
Sig. (2-tailed) |
. |
|||||
|
WFC |
Correlation Coefficient |
-.36 |
1.000 |
|||
|
Sig. (2-tailed) |
.006 |
. |
||||
|
PH |
Correlation Coefficient |
.805 |
.050 |
1.000 |
||
|
Sig. (2-tailed) |
.044 |
.078 |
. |
|||
|
FWC |
Correlation Coefficient |
-.57 |
.045 |
-.003 |
1.000 |
|
|
Sig. (2-tailed) |
.013 |
.025 |
.-064 |
. |
||
|
FS |
Correlation Coefficient |
.33 |
-.010 |
.026 |
.067 |
1.000 |
|
Sig. (2-tailed) |
.042 |
.091 |
.019 |
.042 |
. |
|
Source: SPSS results based on responses on survey questionnaire
The result shows that there is positive relationship between WS and family satisfaction, which indicates that when family satisfaction is observed, WS of an individual employed at Nepalese Airline Companies is also observed (being happy with the kind of work an employee does, being satisfied with the position that employee has, having enough tools and resources to the job, job making good use of employees skill and ability). In this result, family satisfaction is the state of the employee’s perceived happiness where the employee’s ideal life consists of family life, condition of family life is excellent and satisfied, employee has got everything that he or she wants in their life and nothing would be likely to change by the employee therefore, when these are observed in employees’ life there is likely to have WS too.
Similarly, WS have positive relationship with psychological health which indicates that appropriate psychological health of an employee should bring WS. In this result psychological health is the state of employee’s mental health free from depression, anxiety or any mental disorder. This result indicates that better psychological health in an employee such as better concentration level, better sleep with no worries, feeling of playing a useful part, being able to enjoy normal day-to-day activities and being confident results in better WS.
The result shows negative relationship between WS and family work conflict which indicates that when family work conflict exist in employee’s life, there is likely to be work dissatisfaction in employee’s life. The employees of Nepalese Airline Companies are likely to have work dissatisfaction when there is family work conflict. When family related stress, interference and demands are likely to be high, WS is assumed to be low.
Likewise WS has negative relationship with work family conflict which shows that when employee faces work family conflict there is work dissatisfaction. The employees of Nepalese Airline Companies are likely to have work dissatisfaction when there is work family conflict. When work related stress, interference and demands are likely to be high, WS is assumed to be low.
This section basically deals with regression results from various specifications of the models to examine the work life balance with its independent variables like: work-family conflict, family work conflict, family satisfaction and psychological health. Table 4.7 presents the regression of work-family conflict, family work conflict, family satisfaction and psychological health on work life balance of individuals employed at Nepalese Airline companies.
4.4.1 Regression analysis for dependent variable Work Life Balance: The regression of dependent variable of work life balance of individual employed at Nepalese Airline Companies is tabulated in table 4.7
Table 4.6
(Table shows the model summary, where Work Life Balance WLB is the dependent Variable and Psychological Health, Family Work Conflict, Work Family Conflict, Family Satisfaction are independent variable).
Model Summary
|
R |
R2 |
|
0.81 |
0.6561 |
The above table 4.6 illustrate that the coefficient of determinant is 81 percent which indicate that 81 percent of the variance in the dependent variable i.e. work life balance that is predicate from the independent variable.
Table 4.7
Regression of independent variable on Work Life Balance
(The results are based on panel data of employees of Nepalese Airline Companies with 105 observations by using regression model.)
WLB = β0 + FWC β1 + WFC β2 +FS β3 +PH β4 + ε….(i)
|
Model |
Beta |
t-value |
p-value |
F |
p-value |
|
CConstant |
2.832 |
7.319 |
.000** |
.289 |
.008 |
|
FWC |
-.019 |
.395 |
.094* |
||
|
WFC |
-.033 |
-.643 |
.002** |
||
|
FS |
.036 |
-.752 |
.001** |
||
|
PH |
.028 |
-.260 |
.015** |
Source: SPSS result based on responses on survey questionnaire
Note:
- Dependent variable : work life balance
2. **sign indicates that correlation is significant at 5 percent level.
3. *sign indicates that correlation is significant at 10 percent level.
The regression of dependent variable of work life balance of individual employed at Nepalese Airline Companies shows that beta coefficient of family satisfaction and psychological health are positively as indicate in the Table 4.7. The table shows that beta coefficient is positively significant for family satisfaction, which indicates that higher the family satisfaction higher will be the work life balance of the employees. Similarly, beta coefficient is positively significant for psychological health, which indicate that higher the psychological health, higher will be the work life balance of individuals employed at Nepalese Airline Companies. This finding is similar to the findings of Munusamy (2010).
The table above shows that beta coefficient is negatively significant for family work conflict and work family conflict, which indicates that if family work conflict of employee is high, lower will be the work life balance of the employee. Likewise, beta coefficient is negatively significant for work family conflict, which indicates that if work family conflict of an employee is high, lower will be the work life balance of individuals employed at Nepalese Airline Companies.
4.4.2 Regression Analysis for dependent variable Work Satisfaction
Table 4.8
(Table shows the model summary, where Work Satisfaction WS is the dependent Variable and Psychological Health PH, Family Work Conflict FWC, Work Family Conflict WFC, Family Satisfaction FS are independent variable.)
Model Summary
|
R |
R Square |
|
.814a |
.662596 |
The above table 4.8 illustrate that the coefficient of determinant is 81.4 percent which indicate that 81.4 percent of the variance in the dependent variable i.e. WS that is predicate from the independent variable.
Table 4.10
Regression of independent variable on Work Satisfaction.
(Regression of independent variable on Work satisfaction (The results are based on panel data of employees of Nepalese Airline Companies with 105 observations by using regression model.)
WS= β0 + FWC β1 + WFC β2 +FS β3 +PH β4 + ε…………… (ii)
|
Model |
Beta |
t-value |
p-value |
F |
p-value |
|
Constant |
3.094 |
3.733 |
.000 |
0.331 |
.005 |
|
FWC |
-.093 |
.903 |
.069 |
||
|
WFC |
-.002 |
.015 |
.008 |
||
|
FS |
.062 |
.611 |
.001 |
||
|
PH |
.001 |
-.005 |
.001 |
Source: SPSS result based on responses on survey questionnaire
Note:
- Dependent variable: Work Satisfaction.
2. **sign indicates that correlation is significant at 5 percent level.
3. *sign indicates that correlation is significant at 10 percent level.
The regression of dependent variable of WS of individual employed at Nepalese Airline Companies shows that beta coefficient of family satisfaction and psychological health are positively as indicate in the Table 4.7. The table shows that beta coefficient is positively significant for family satisfaction, which indicates that higher the family satisfaction higher will be the WS of the employees. Similarly, beta coefficient is positively significant for psychological health, which indicates that higher the psychological health, higher will be the WS of individuals employed at Nepalese Airline Companies.
The table above shows that beta coefficient is negatively significant for family work conflict and work family conflict, which indicates that if family work conflict of employee is high, lower will be the WS. Likewise, beta coefficient is negatively significant for work family conflict, which indicates that if work family conflict of an employee is high, lower will be the WS of individuals employed at Nepalese Airline Companies.
4.5 Testing of Hypothesis and Preposition.
In order to study the significance of relationship between study variables, the hypothesis testing has been used. The testing of the hypothesis was done both by the correlations analysis and regression analysis via test of significance for the study variables.
Table 4.11
Summary of Hypothesis Testing
(The table shows the summary of hypotheses testing of the study.)
|
S.No |
Null hypotheses |
Tools used |
Tools used |
Decisions |
|
1. |
Work-Family Conflict is negatively correlated with Work Life Balance and WS |
Correlation |
Regression |
Accepted |
|
2. |
Family-Work Conflict is negatively correlated with Work Life Balance and WS. |
Correlation |
Regression |
Accepted |
|
3. |
Family Satisfaction is positively correlated with Work Life Balance and WS. |
Correlation |
Regression |
Accepted |
|
4. |
Psychological Health is be negatively correlated with Work Life Balance and WS. |
Correlation |
Regression |
Accepted |
From the above table it is shown that the entire hypothesis that were underlined proved to be accepted.
Hypotheses 1: (H1) Work-Family Conflict is negatively correlated with Work Life Balance and WS. Since, work family conflict significantly impacts work life balance and WS negatively, it implies that work family conflict plays an important role in work life balance and WS.
Hypotheses 2: (H2) Family-Work Conflict is negatively correlated with Work Life Balance and WS. Since family work conflict significantly impacts work life balance and WS negatively, it implies that family work conflict plays an important role in work life balance and WS
Hypotheses 3: (H3) Family Satisfaction is positively correlated with Work Life Balance and WS. Since family satisfaction significantly impacts work life balance and WS positively, it implies that family satisfaction plays an important role in work life balance and WS.
H4 Psychological Health is be negatively correlated with Work Life Balance and WS. Since psychological health significantly impacts work life balance and WS positively, it implies that psychological health plays an important role in work life family and WS.
In conclusion to testing of the hypothesis and preposition it can be said that all the hypothesis that was formed previously in chapter I is found true. Hence this study implies that family satisfaction and psychological health positively affect work life balance and work satisfaction. Whereas, family satisfaction and psychological health negatively affect work life balance and work satisfaction.