Diversification within UK Private Real Estate Portfolios
A Critical Appraisal of the Literature on Diversification within Private Real Estate Portfolios in the United Kingdom
Abstract
 One of the two major ways in which institutional investors can invest in real estate is “private real estate”. Private real estate is to purchase un-securitized real estate directly through property pools, commingled real estate funds (CREFs), syndications or separate accounts that are managed by professional real estate portfolio managers or investment advisors. This form of ownership will henceforth be referred to as “private real estate”. There are different drivers of investing within the private real estate portfolios, including markets, sectors, management, area/building specific, scale, diversification, liquidity, tax and governance risks. The private real estate has a low level of linear dependence on equity, so private real estate requires the diversification of its portfolios. This paper provides a critical appraisal of the literature on diversification within private real estate portfolios. Does a U.K. market need to do the diversification within private real estate portfolios when British people need it? Not really.
- Literature Review
 Investment in private real estate offers considerable advantages: it is a tangible asset with low volatility; and it generates an attractive income stream and long-term capital appreciation and particularly strong diversification benefits to stocks and bonds. Thus, there is extant literature showing that private real estate has a significant place in the U.S. mixed-asset portfolio: see Ziobrowski and Ziobrowski (1997); and Firstenberg, Ross & Zisler (1998); among others.
 Researchers conducted several studies on real estate’s role as a component of asset-only portfolios, specifically focusing on real estate’s diversification benefits. These studies compensate for some of the issues with real estate data, in particular, that of valuation smoothing. Most of these studies conclude that the allocation to real estate should be from 10% upward. The results indicate that limited diversification benefits can be gained from international investments in pure office strategies, particularly for multi-asset investors seeking to reduce risk stemming from the capital markets.
 Existing empirical evidence is generally consistent with firm owners’ portfolio diversification having a positive impact on their firms’ risk taking (e.g., Amihud and Lev (1981) and Faccio, Marchica and Mura (2011)). The general theme in the existing literature is that firm riskiness can be reduced primarily by means of choosing safer investments, i.e. investments that result in lower cash flow volatility or stock return volatility (e.g., Lyandres, Marchica, Michaely, and Mura (2015) and Faccio, Marchica and Mura (2011)), or lower correlation with the rest of the firm decision makers’ cash flows (e.g., Amihud and Lev (1981) and Gormley, Matsa and Milbourn (2013)).
 The association between private (constrained) firm owners’ portfolio diversification and investment is negative and significant in most cases (Lyandres, Marchica, Michaely, and Mura, 2015). Lyandres, Marchica, Michaely, and Mura (2015) study possible endogeneity of firm owner’s portfolio diversification and of firm’s private status does not seem to drive their results. The inclusion of owner fixed effects does not impact the qualitative relation between owners’ portfolio diversification and private firms’ capital investment (Lyandres, Marchica, Michaely, and Mura, 2015). However, the fixed-effects results may still be affected by self-selection: better-diversified owners may select to invest in companies with higher investment rates, which better their risk preferences. Lyandres, Marchica, Michaely, and Mura (2015) suggest the firms’ capital investment depends on portfolio diversification of their controlling owners; the effect of owners’ portfolio diversification on firms’ investment levels depends crucially on firms financial constraints: the investment-diversification relation is positive for relatively unconstrained firms and is negatively for relatively constrained ones. Owner fixed-effects, a quasi-natural experiment, and instrumental variable analysis suggest that this result is not driven by potential endogeneity of owner’s diversification.
 A matched-sample analysis, selection model, and an alternative measure of financial constraints show that Lyandres, Marchica, Michaely, and Mura (2015)’s findings are also not driven by the endogeneity of their proxy for financial constraints. The analysis builds on and extends that of Hoesli et al. (2004) but broadens the length of the time series and the depth of analysis as they pertain to the real estate portfolio. They concluded that both domestic and international real estate contribute with risk diversification, and therefore portfolio efficiency, to the multi-asset portfolio and that the data support an allocation to real estate of between 15 and 25%, depending on risk preferences and the investor’s country of domicile.
 The purpose is to investigate how the composition of a real estate portfolio affects the ability to achieve risk diversification when management costs are taken into account and after removing the assumption that investors can only by a real estate market portfolio. The analysis contributes to the body of knowledge by exploring how the type of underlying tenant demand type affects the portfolio composition problem for real estate investors and thus how real estate strategies should be fashioned to more effectively support overall portfolio objectives.
 Hoesli and Lizieri (2007) report correlations close to zero for private real estate in the UK. Lizieri (2013) finds that the correlation of the private real estate varies significantly over the market cycle, tending to increase in periods from 1995 to 2010 of poor stock market performance. Lizieri (2013) finds that the correlations of private real estate with equities and bonds changed in the last five years of the sample from around zero to 0.4 and -0.5 respectively. This would indicate that the diversification benefits from real estate disappear when they are most needed. However, it is also found that when the variance is decomposed, a high proportion of private real estate variance cannot be explained by wider capital market factors, which indicates substantial diversification benefits. Even though data construction issues for private real estate cannot be ruled out, Lizieri (2013) concludes that the results support the diversification role of the private real estate.
 Ang (2012) explores the characteristics of real estate in the context of its real asset characteristics along with real estate’s role in the asset allocation puzzle. Ang (2012) concludes that real estate is different from other asset classes in several respects: the idiosyncratic risk, the heterogeneity of the assets and requirement to actively mange real estate holdings. Ang (2012) also points out the difficulty of including real estate in any asset allocation model on par with stocks and bonds because direct real estate total returns are not returns in the same sense as are total returns for the other asset classes. This is because real estate total returns are not transaction based nor is there a way to measure the whole market. Ang (2012) does not say that real estate has no role to play but rather that the only return derived from real estate measured on the same frequency as the return on mature asset classes is the income return.
- Diversification of the Private Real Estate Portfolios with Equity REIT shares
 An examination of resulting efficient frontiers and their corresponding optimal portfolio weights across various levels of expected return reveals that the ability of public real estate to rebalance and diversify private real estate only portfolios, using either long or short positions, is very much in doubt (Seiler, Webb and Neil Mye, 2001). Private real estate helps reduce the risk of a portfolio because it has less than a perfect correlation with stocks, bonds and all other assets.
- Qualitative Analysis
 Standard Markowitz portfolio selection model assumes jointly normal and symmetric distributions. If that holds, then mean, variance and covariance are sufficient to define effective diversification strategy. Traditional diversification strategies no longer provide desired level of protection in bear markets. Portfolio risk and expected value fall in bear markets are systematically understated. Traditional notions of risk-return trade-off are systematically overstated. Frequent portfolio rebalancing needed to maintain target level of risk, leading to higher transaction costs. For example, Stichting Pensioenfonds X: Asset Mix is an archetypical private real estate portfolio. 9% property allocation is reasonable for a well funded and growing scheme if assume under-performs equities and out-performs bonds and adds some diversification.
 Higher portfolio diversification reduces the variance of owner’s portfolio return and its covariance with the firm’s cash flow. As a result, higher portfolio diversification of firm owner lowers the risk avoidance incentives and leads to increased risk taking by the firm. The direct effect of higher owner’s portfolio diversification on an unconstrained firm’s capital investment is through the reduction in the variance of owner’s wealth and the resulting decrease in his or her risk-avoidance incentives. A more diversified owner is less concerned with higher cash flow volatility resulting from higher operating leverage, and chooses a higher level of capital investment. The result is a positive relation between owner’s portfolio diversification and firm investment for unconstrained firms.
 The mechanism behind the negative relation between a constrained firm’s investment and its owner’s portfolio diversification is different. A constrained firm cannot increase its capital investment level in response to an increase in firm owner’s portfolio diversification, as its investment is determined by the investment capacity constraint. The only channel the constrained firm can use to alter its cash flow volatility is the riskiness of its investments.
 The scale/diversification of assets depends upon the genuine efficiency from scale, diversification and impact on equity rising and the decrease of the default. The portfolio of loans demands diversification during the debt and credit crisis. High correlation among portfolios means diversification across sectors relatively little impact on risk reduction in UK historically compared to specific risk.
 The degree of portfolio diversification of a firm’s controlling owner may influence its choice of riskiness of firm strategies. The reason is that an expected-utility-maximizing risk-averse owner takes into account the variance of the private real estate’s overall wealth when making decisions on behalf of the firm the CEO controls.
-
Drivers of diversification from equities
- Drivers of rents
- Demand-GDP, business and financial services, consumer spending, distribution, general price inflation, technology, profitability and other investment sentiment drivers.
- Supply-Construction, planning, obsolescence
- Drivers of yields
- Interest rates/term structure, credit availability, credit sentiment (high grade versus low grade), property sentiment.
- Other factors
- Tax/political risks, property specific (e.g. lease structures)
 The earlier studies revealed real estate, with all its illiquidity, management intensity and information asymmetry, does exhibit characteristics that complement the multi-asset portfolio by contributing diversification (Lekander, 2015). But the findings go further to suggest that diversification objectives in low-risk overall strategies are best achieved via types of real estate in which the tenant demand is less affected by global factors, whereas diversification strategies for higher overall risk strategies are best supported by real estate strategies focusing on globally dependent real estate (Lekander, 2015).
 When accounting for the cost of liquidity, by defining the market value as the mean of the buyer reservation price distribution, a different return pattern emerges. This has implications on the correlation characteristics of real estate, reducing the real estate’s diversification potential. A similar bias affects investment indices through the population of transactions available to the appraiser to determine price evidence. As such, there is a risk that the return indices measuring private real estate performance are based on market evidence that suffers from selection bias and appraisal smoothing, thus skewing the characteristics of the private real estate returns.
 A form test of the superiority of economic-based diversification strategies for real estate portfolio diversification was undertaken by Mueller (1992). Mueller (1992) showed that a diversification strategy based on his own classification, which relies solely on economic base, provided even greater risk-adjusted return possibilities.
- Data and Quantitative Analysis
- Model
 The estimates produced and updated are based on a two-quadrant approach looking at private real estate (holdings of funds and other private investors) and private real estate debt (lending by banks and other institutions). I consider a situation in which a firm’s controlling owner is entitled to a proportion  of the firm’s cash flow. In addition, the firm’s owner is endowed with initial wealth x outside of the controlled firm, which is invested in an imperfectly diversified portfolio with a normally distributed return, whose mean is
  and whose standard deviation is
  . Our model abstracts from the reasons for imperfect diversification of the firm’s owner, which is a feature consistent with the data. The focus is on the effects of imperfect diversification of owners’ portfolios on controlled firms’ investment strategies.
 I assume that the firm’s controlling owner is risk-averse and that the CEO maximizes the expected utility of his or her terminal wealth,  . This utility is given by
 ,
,
where  is the firm owner’s Arrow-Pratt coefficient of absolute risk aversion. Assuming that the firm’s cash flow (discussed below) is normally distributed, investor’s expected utility maximization simplifies into the mean-variance criterion:
 .
.
 The model shows that in order to understand the impact of firm owners’ portfolio diversification on firms’ investment strategies, it is crucial to consider simultaneous choices of both the level and riskiness of firms’ investments. The analysis focuses on the relation between owner’s portfolio diversification and firm’s investment level, extends and complements the existing literature that focuses on the riskiness of firm’s investment. The interaction between these two decisions results in a non-trivial and somewhat surprising relation between owner’s portfolio diversification and the level of her or his firm’s capital investment.
-
Comparative statics
- Lemma 1: If the investment capacity constraint is not binding in equilibrium, then the firm’s equilibrium level of capital investment and its riskiness,
 and
and  respectively, are given by the following system of equations:
- Lemma 1: If the investment capacity constraint is not binding in equilibrium, then the firm’s equilibrium level of capital investment and its riskiness,
 ,
,

subject to  .
.
 I am interested in the effects of controlling owner’s portfolio diversification on the choice of the level and riskiness of capital investment of constrained and unconstrained firms. In what follows, we present comparative statics of the firm’s investment level and its riskiness with respect to the standard deviation of the owner’s portfolio, . I also graphically illustrate these comparative statics using the numerical example to help explain the intuition. Totally differentiating the unconstrained equilibrium conditions in (3) and (4) with respect to owner’s portfolio standard deviation produces the following result:
Proposition 1 For a firm whose capital investment is unconstrained in equilibrium, , equilibrium level of capital investment and its riskiness, and respectively, are decreasing in the standard deviation of firm owner’s portfolio, .
 The owner’s objective function is:

subject to 
 Maximizing the owner’s expected utility in (5) with respect to  , while assuming that the investment capacity is binding, i.e., that
  , leads to the following result:
Lemma 2 If the investment capacity constraint is binding, , then the firm’s equilibrium riskiness of investment,  , is given by the following equation:

- Data
 The UK data are from the Investors Chronicle Hillier Parker (ICHP) Index and comprise 32 semi-annual observations from 1977 to 1993. The UK data are available disaggregated by three property types (offices; industrial; and retail) and by 11 regions (London, South East, South West, East Anglia, East Midlands, West Midlands, Wales, Yorkshire and Humberside, North, North West, Scotland). The data exclude shopping centres, mixed use buildings, and business space. Data for the U.K. 11 regions were also aggregated to produce three “super” regions as suggested by Key et al. (1994). These regions are London, South and North.
- Quantitative Analysis Results
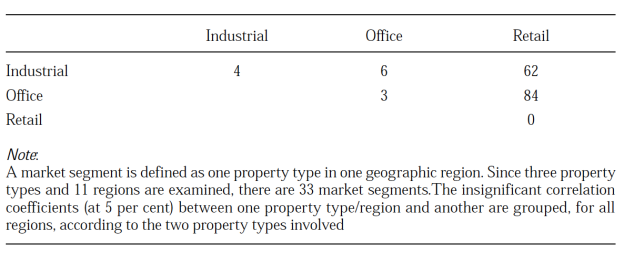
 The estimated correlation matrices for the three UK property types and three UK regions are shown in Table I and II. As the number of regions differs from the number of property types, there is no test for the UK 11 region data comparable with the one undertaken above. It is, nonetheless, informative to analyse this data. This is done by calculating the correlations between all market segments, in which a market segment is defined as one property type in one region. The full matrix is given in Table III.
 In the UK it is a conventional wisdom that retail property offers least scope for regional diversification: retail sales tend not to have strong regional differences and the supply response of the retail property market does not differ significantly across regions. In contrast, in the office market, as the London market is driven by the financial sector has a strong international dimension; opportunities should exist for regional diversification within the office market.
Table I. UK correlations based on semi-annual returns for 11 regions and three property types (1977-1993)
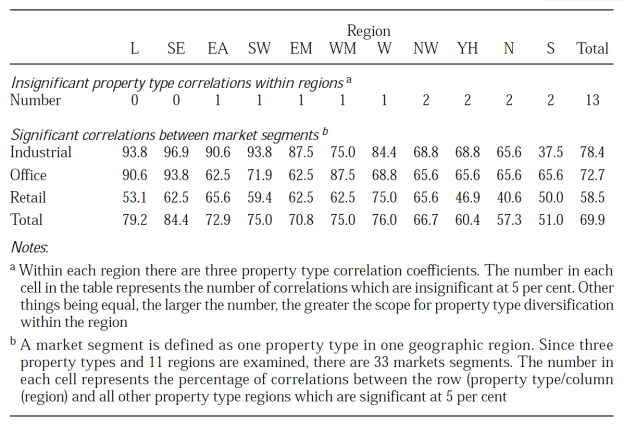
 In conclusion, the results show that the scope for diversification within a region varies from region to region and is greatest the further from London, while the diversification within property type is generally limited but is better for office and industrial property. Retail property is poorly correlated with either industrial or offices. Thus, full diversification by both property type and region is to be preferred.
Table II Insignificant correlations between market segments by property type, based on semi-annual returns, UK, 1977-1993
- IPD/MSCI Data to Explore the Most Important Characteristics of Diversification in Private Real Estate
 MSCI IPD is the only global provided of appraisal-based total return indices for private real estate across a number of different geographical markets. In this subsection, we look at the main factors affecting the performance of financial investments, i.e. economic growth, inflation and interest rates. These are the most important characteristics in driving differences in performance across the private real estate market over the past few decades. Also, the impact of these factors is partially overlaid with endogenous dynamics of real estate markets resulting from lagged responses of supply and demand. This subsection mainly suggests a specific real estate factor may exist that drives real estate returns but is not common with the drivers of equities or bonds, indicating the existence of long-term diversification benefits of private real estate.
Table III: Comparison of key statistics for selected total return indices in the UK
|
UK (1990-2014, monthly) |
Average return |
Standard deviation |
Sharpe ratio |
|
Private RE (smoothed) |
7.46% |
3.76% |
0.69 |
|
Private RE (unsmoothed) |
7.46% |
7.49% |
0.37 |
|
Private Re (trans.-based) |
10.39% |
8.84% |
0.06 |
Source: IPD and EPRA. IPD data available since 1987 but presented since 1990 to align with other indices. Sharpe ratio calculated relative to three-month T-bills.
Table IV: Overview of average annual returns and volatilities for selected international private real estate indices
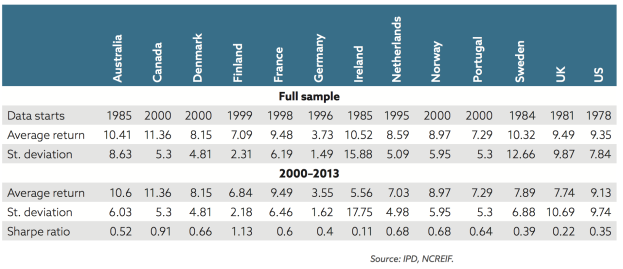
 Table IV summarizes the risk-return statistics of the IPD and NCREIF indices across a number of countries. Whilst we are aware that the statistical significance of comparisons based on only few observations is low, it is striking that the UK market is among the most volatile ones. The broad market opinion that the UK real estate market observes tends to see stronger cyclical movements. On the other hand, the UK private real estate market offers higher liquidity and market depth.
 Changes in the levels and volatility of returns from commercial real estate investments in the UK over a rolling ten-year view is presented in Figure 1.
Figure 1: Rolling ten-year average returns and return volatilities in the UK
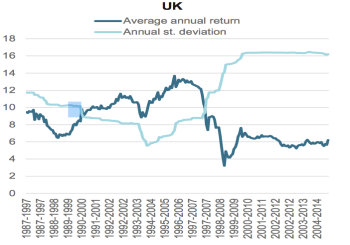
 The risk-return profile of the UK market shows a regime shift following the financial crisis. Also, for the UK, unsmoothed real estate indices show Sharpe ratios comparable or slightly above the levels measured for equity and bond indices. However, one needs to consider that risk-return profiles may not be stable over time. Also, the risk-return profiles of investments may be different for long-term investors, although there is no conclusive evidence that the reduction of the effective volatility should be higher for real estate than for other types of assets. However, the fact that a high proportion of the return is derived from income may indeed favor real estate in the long term.
- Real estate factor
 The existence of a specific real estate factor is highly relevant for the construction of investment portfolios based on fundamental factors. Recent research supports the existence of such a factor for commercial private real estate. In order to verify the existence of a real estate factor, I ran a factor analysis for the UK following the reasoning of Mei and Lee (1994). Monthly data were used in the UK. A higher absolute value for a loading means that the factor has a higher impact, positive or negative, on the returns of the index, while a value close to zero indicates no significant impact.
Table 5: Factor loading of stocks, bonds and alternative real estate index returns
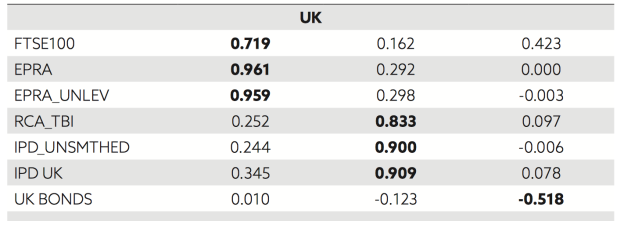
Source: my own calculations.
 The highest absolute loading for each index has been highlighted in bold in Table 5. While the levels of the loadings are not directly interpretable, the regularity in their relative values is striking. Factor F1 loads highly on stock market indices and on pubic real estate indices. In fact, it appears to represent mainly listed real estate, while pure stock indices are also influenced by F3. Factor F2 loads very highly on all private real estate indices, both smoothed and unsmoothed, as well as transaction-based indices. Factor F3 loads most strongly on bond indices and to a lower extent on stock indices. It appears justified to label F1 as a “stock market factor” and F2 as a “real estate factor”, while F3 could be associated with monetary factors such as interest rates. The above results represent a strong indication that the factor that drives direct real estate returns may indeed differ from the one that drives the returns of equities or bonds. While it is impossible to conclude on the basis of this analysis what particular risks or drivers this factor might reflect, they seem to be different to the risks and drivers behind the equities or fixed income, which should create diversification potential.
- Conclusion
 The sections above have provided a critical appraisal of the literature on diversification within private real estate portfolios. For the UK, the opposite result was obtained for retail property and diversification across both property types and regions was to be preferred for the other two property types.
 The results offer some insights into real estate performance and may offer some input into the determination of a diversification ion strategy for a real estate portfolio. There are two major qualifications on the results. The first is that they are historical results and they may not be a good proxy for the future correlations. Historical returns are unlikely to be a good proxy for future returns and that probably also holds for the correlations calculated between real estate categories. The second qualification is that investors have objectives, which are more complex than just the trade-off between the level of period return and volatility of period return.
 Behind the analysis of regional economic base is the reasonable presumption that similarity in economic structure and performance should lead to similarity in real estate performance. However, such analyses, which focus on demand proxies, ignore supply or, at best, assume no differences in supply responses across property type or region. Testing the economic base ideas with highly disaggregated returns data is therefore very important. The UK data allow comparisons of the economic similarity of regions and the similarity of property performance. It would then be possible to infer from the UK results whether the proxying of real estate performance with economic performance is valid and perhaps at what spatial scale.
Table III Real Estate Portfolio Diversification

- References
Amihud, Y. and Lev, B., 1981. Risk reduction as a managerial motive for conglomerate mergers. Â The bell journal of economics, pp.605-617.
Ang, A., 2012. ‘Real’Assets. Columbia Business School Research Paper No. 12-60.
Faccio, M., Marchica, M.T. and Mura, R., 2011. Large shareholder diversification and corporate  risk-taking. Review of Financial Studies, 24(11), pp.3601-3641.
Firstenberg, P.M., Ross, S.A. and Zisler, R.C., 1988. Real estate: the whole story. The Journal of  Portfolio Management, 14(3), pp.22-34.
Gormley, T.A., Matsa, D.A. and Milbourn, T., 2013. CEO compensation and corporate risk: Â Evidence from a natural experiment. Journal of Accounting and Economics, 56(2), pp.79-101.
Hoesli, M., Lekander, J. and Witkiewicz, W., 2004. International evidence on real estate as a  portfolio diversifier. Journal of Real Estate Research, 26(2), pp.161-206.
Hoesli, M. and Lizieri, C., 2007. Real estate in the investment portfolio. A report for the  Investment Strategy Council of the Royal Ministry of Finance.
Key, T., Zarkesh, F., MacGregor, B. and Nanthakumaran, N., 1994. Understanding the property  cycle. Main report: Economic cycles and property cycles. London: RICS.
Lekander, J.R., 2015. Real estate portfolio construction for a multi-asset portfolio. Journal of Property Investment & Finance, 33(6), pp.548-573.
Lizieri, C., 2013. After the fall: Real estate in the mixed-asset portfolio in the aftermath of the  global financial crisis. The Journal of Portfolio Management, 39(5), pp.43-59.
Lyandres, E., Marchica, M.T., Michaely, R. and Mura, R., 2015. Owners’ Portfolio  Diversification and Firm Investment: Evidence from Private and Public Firms.
Mueller, G. and Ziering, B., 1992. Real estate portfolio diversification using economic  diversification. Journal of Real Estate Research, 7(4), pp.375-386.
Seiler, M., Webb, J. and Neil Mye, F., 2001. Can private real estate portfolios be  rebalanced/diversified using equity REIT shares?. Journal of Real Estate Portfolio  Management, 7(1), pp.25-41.
Ziobrowski, B. and Ziobrowski, A., 1997. Higher real estate risk and mixed-asset portfolio  performance. Journal of Real Estate Portfolio Management, 3(2), pp.107-115.